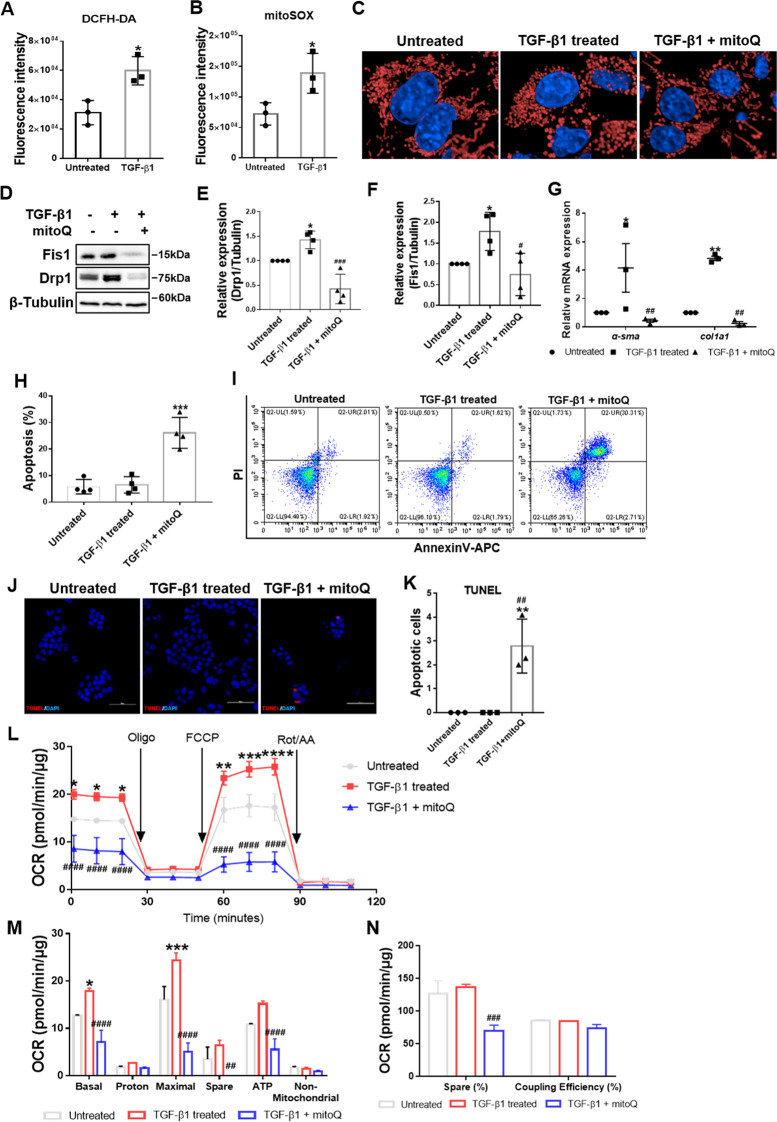
Fig. 8. Effects of mitoQ on active HSCs.
A, B Cellular and mitochondrial ROS levels in quiescent and active HSCs were detected by flow cytometry. Two-tailed unpaired t-test. C Representative confocal immunofluorescence microscopy of the mitochondrial dynamics in HSCs. Scale bar, 5 μm. Fragmented mitochondria in active HSCs were reversed to an elongated state after mitoQ treatment. D–F Immunoblotting and statistical analysis for relative expression of Fis1 and Drp1 after mitoQ treatment. Data were normalized to β-tubulin. Ordinary one-way ANOVA with Turkey’s multiple comparisons test. G Relative mRNA expression for α-sma and col1a1 normalized to Rps18. Two-way ANOVA with Turkey’s multiple comparisons test. H–K Apoptosis was detected and analyzed by flow cytometry (H, I) and immunofluorescence (J, K), stained by Tunel. Ordinary one-way ANOVA with Turkey’s multiple comparisons test. L Mitochondrial stress test on HSCs after mitoQ treatment. The OCR was normalized to the protein amount. M, N Measured and calculated parameters of mitochondrial respiration. Ordinary one-way ANOVA with Turkey’s multiple comparisons test. Data are expressed as means ± SD, with n = 3 biological replicates in A, B, G and K, n = 4 replicates in E, F and H. Data are means ± SEM from three independent experiments in (L–N). *P < 0.05; **P < 0.01; ***P < 0.001 vs. Untreated; #P < 0.05; ##P < 0.01; ###P < 0.001; ####P < 0.0001 vs. TGF-β1-treated group.

