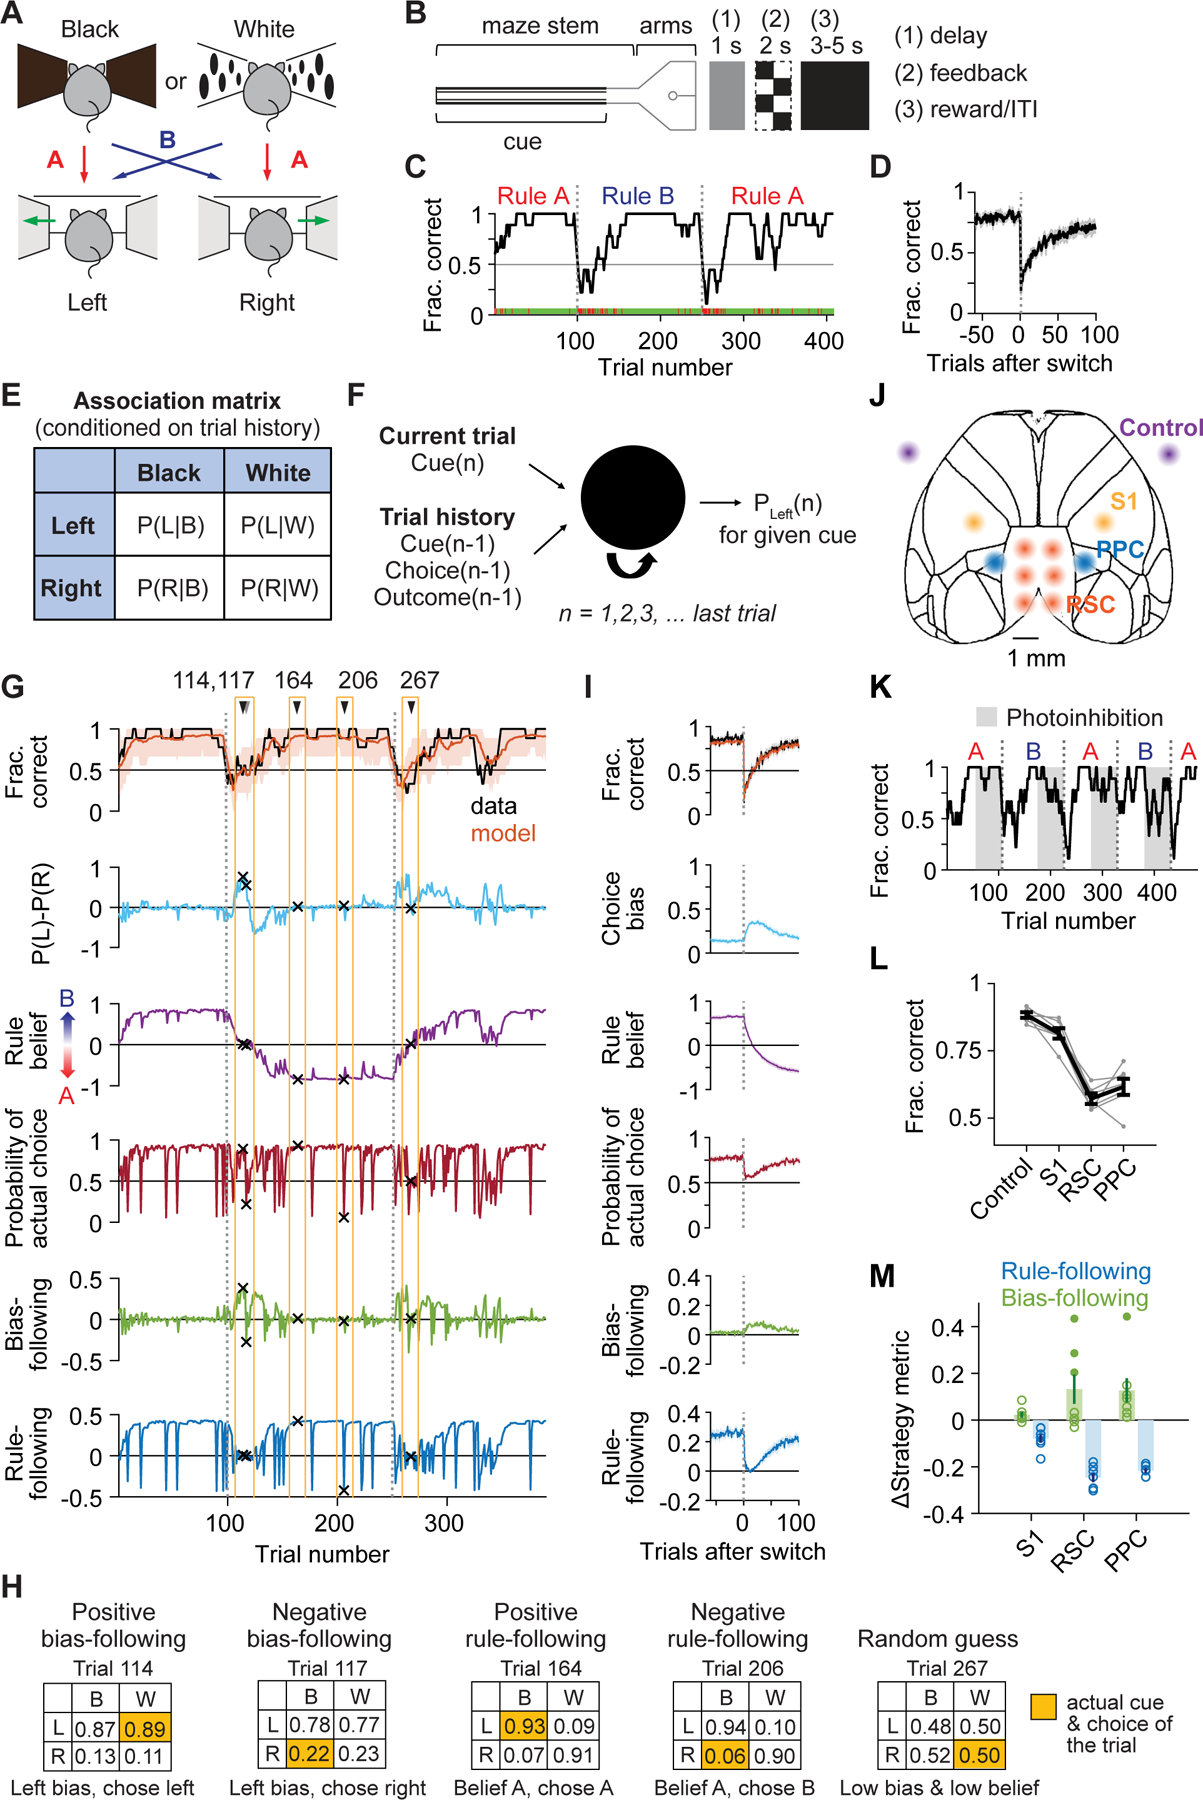
Figure 1. Diverse decision-making strategies during flexible navigation decisions and photoinhibition in posterior cortex.

(A) Rewarded cue-choice associations for rules A and B.
(B) Maze configuration and structure of trial epochs. At the trial end, after a delay, mice received visual feedback about the correctness before a reward and inter-trial interval.
(C) Task performance for an example session. Green ticks, correct trials; red ticks, incorrect trials; black line, smoothed performance (boxcar of 9 trials); gray dashed line, rule switches.
(D) Switch-aligned performance. n = 513 switches from 8 mice.
(E) Association matrix used to quantify strategy variables: the probability of choosing left or right given a black or white cue for a given trial, conditioned on its trial history.
(F) Schematic of LSTM for deriving the association matrix on each trial.
(G) Modeled fraction correct and strategy variables for an example session. Orange shading, 90% CI from 1000 simulations of task performance from the model.
(H) Association matrices for the 5 example trials in (G).
(I) Switch-aligned modeled fraction correct and strategy variables. n = 265 switches.
(J) Bilateral inhibition sites in VGAT-ChR2 mice.
(K) Task performance of an example session during photoinhibition.
(L) Effects of photoinhibition on task performance. Gray lines, individual mice; black line, all mice. Control vs. RSC or PPC: p < 10−4; control vs. S1: p = 0.0002; S1 vs. RSC or PPC: p < 10−4; RSC vs. PPC: p = 0.058. n = 164 sessions from 7 mice.
(M) Effects of photoinhibition on strategy variables, measured as differences from control. Open circles, average for individual mice. For bias-following, p = 0.025 for S1, p = 0.018 for RSC, p < 10−4 for PPC; for rule-following, p < 10−4 for all targets. Filled circles indicate mice with large increase in bias-following (greater than 0.2; 3 mice for RSC and one mouse for PPC).
Data and statistics in (D), (I), (L), (M) are presented as hierarchical bootstrap mean ± SEM.
See also Figure S1.
