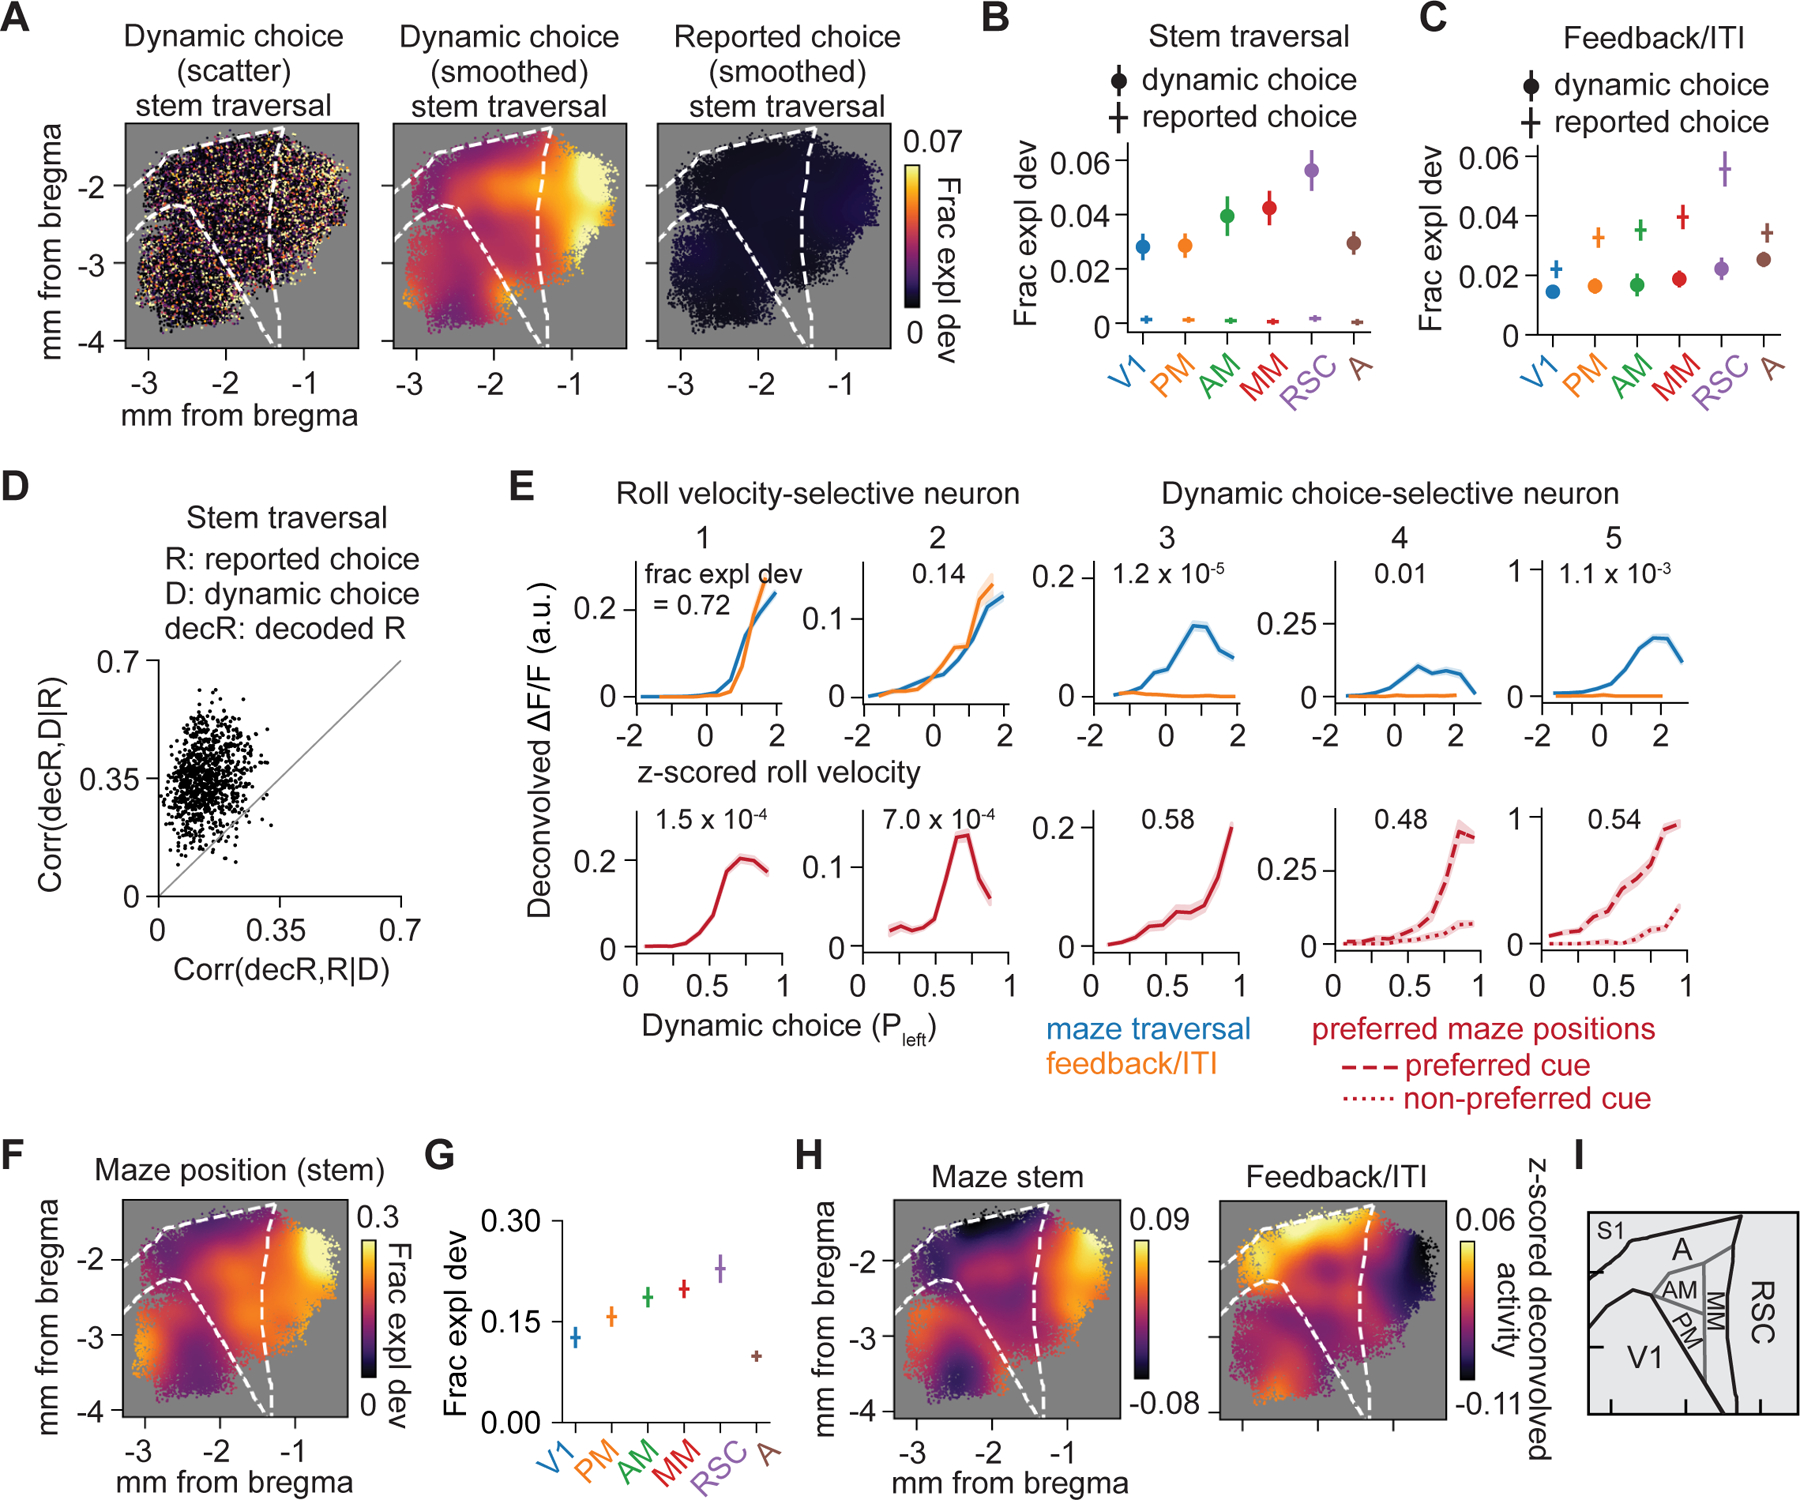
Figure 4. Encoding of choice and maze position.

(A) Encoding magnitude (left) and smoothed map of dynamic choice (middle) and smoothed map of reported choice (right) during stem traversal.
(B) Average encoding magnitude of dynamic choice and reported choice during stem traversal for 6 areas. All 6 areas: dynamic choice vs. reported choice, p < 10−3. Dynamic choice: RSC vs. V1, PM or A, p < 10−3; RSC vs. AM or MM, p > 0.05. Reported choice: each area vs. zero, p > 0.05.
(C) Same as (B), but in feedback period/ITI. All 6 areas: reported choice vs. dynamic choice, p < 10−3. Reported choice, RSC vs. each other area, p < 0.05.
(D) Partial correlation (Spearman) of decoded reported choice (decR) with dynamic choice (D), conditioned on reported choice (R) (bootstrap mean ± SEM, 0.35 ± 0.02) vs. partial correlation of decR with R, conditioned on D (bootstrap mean ± SEM, 0.14 ± 0.02) during stem traversal. Each point represents one population decoder consisting of ~100 nearby neurons. Mean difference between the two partial correlations is greater than 0 (bootstrap mean difference ± SEM, 0.21 ± 0.02, p < 10−3). n = 974 decoders.
(E) Tuning curves for roll velocity (top; plotted during maze traversal and feedback period/ITI) and dynamic choice (bottom; plotted at each neuron’s preferred maze position) for two roll velocity-selective neurons (neuron 1 and 2) and three dynamic choice-selective neurons (neuron 3–5). The GLM-derived encoding magnitude (fraction explained deviance) for that variable is indicated on each panel.
(F) Smoothed encoding map of maze position during stem traversal.
(G) Average encoding magnitude for maze position during stem traversal for 6 areas. RSC vs. V1, PM, or A, p < 10−3; RSC vs. AM or MM, p > 0.05.
(H) Smoothed maps of average z-scored deconvolved activity during the maze stem (left) and feedback period/ITI (right).
(I) Schematic of area parcellation.
Data and statistics in (B), (C), (G) are presented as hierarchical bootstrap mean ± SEM.
See also Figure S5.
