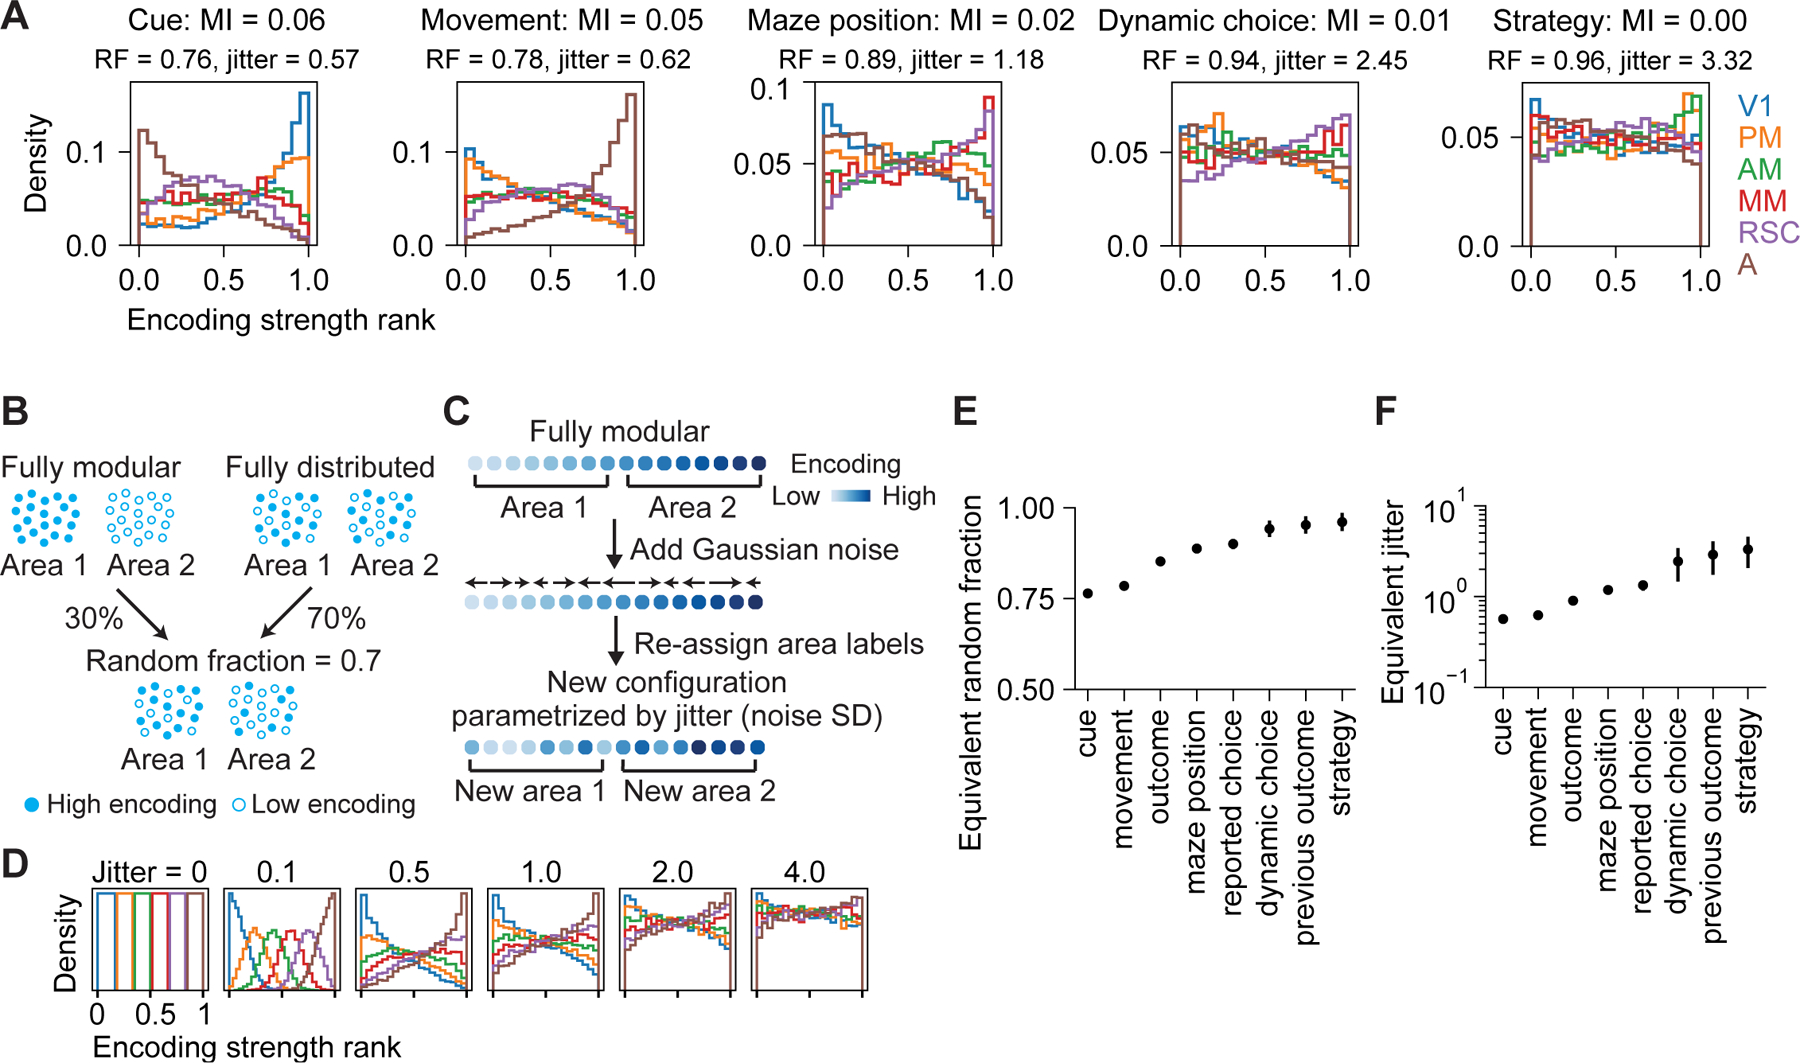
Figure 5. Distributedness of encoding across posterior cortical areas.

(A) Distribution of encoding strength rank of single neurons in 6 areas for various variables. MI, normalized mutual information between encoding strength and area identity; RF: equivalent random fraction; jitter, equivalent jitter; see (B) and (C).
(B) Schematic of toy models generated by mixing fully modular and fully distributed configurations with random faction = 0.7.
(C) Schematic of toy models generated by perturbing the encoding strength rank of the fully modular configurations by adding Gaussian noise (parametrized by jitter, or Gaussian noise SD) to the rank.
(D) Distribution of encoding strength rank for toy models in (C) generated with different jitter values.
(E-F) Equivalent random fraction and jitter for various variables. Bootstrap mean ± SEM.
See also Figure S6.
