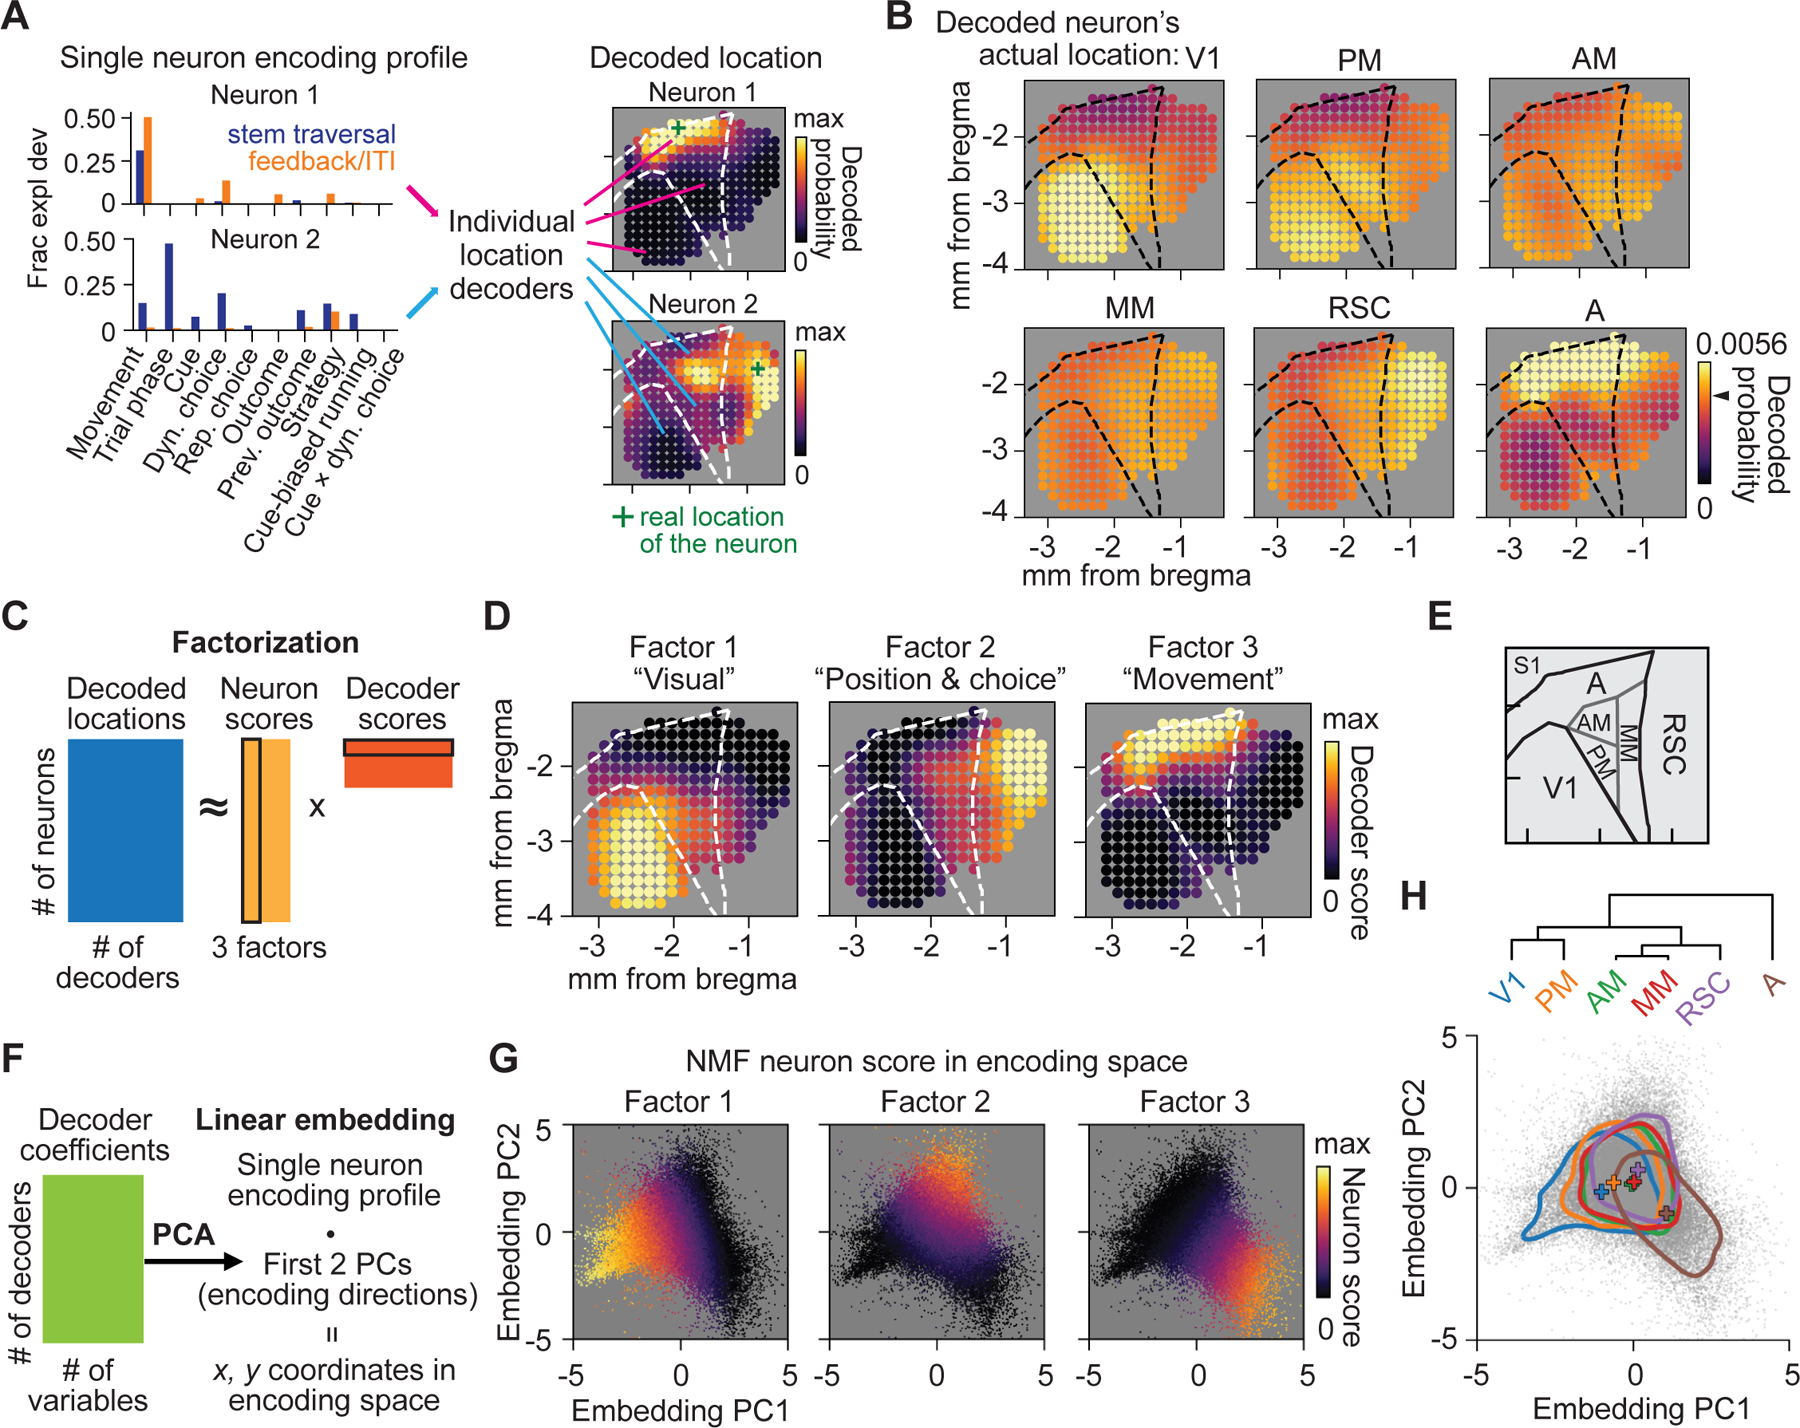
Figure 6. Distinct spatial gradients of encoding in posterior cortex.

(A) Examples of decoding cortical locations from GLM-derived encoding profiles of single neurons.
(B) For all neurons in one of 6 areas, the average decoded probability distribution of a neuron’s location over posterior cortex. Chance level is 0.0041 (1/number of location decoders; black arrow on the color bar).
(C) Schematic of the non-negative factorization (NMF) of the decoded locations of all neurons.
(D) NMF decoder scores plotted spatially for each non-negative factor.
(E) Schematic of area parcellation.
(F) Schematic of embedding of single neuron encoding profiles.
(G) All neurons embedded in the encoding space, colored with the NMF neuron scores for each factor.
(H) Top: dendrogram showing hierarchical clustering of 6 areas by centroid locations. Bottom: Summary of distribution of neurons in 6 areas in the encoding space. Colored lines, contours at 25% of the peak density; plus signs, centroid locations.
See also Figure S6.
