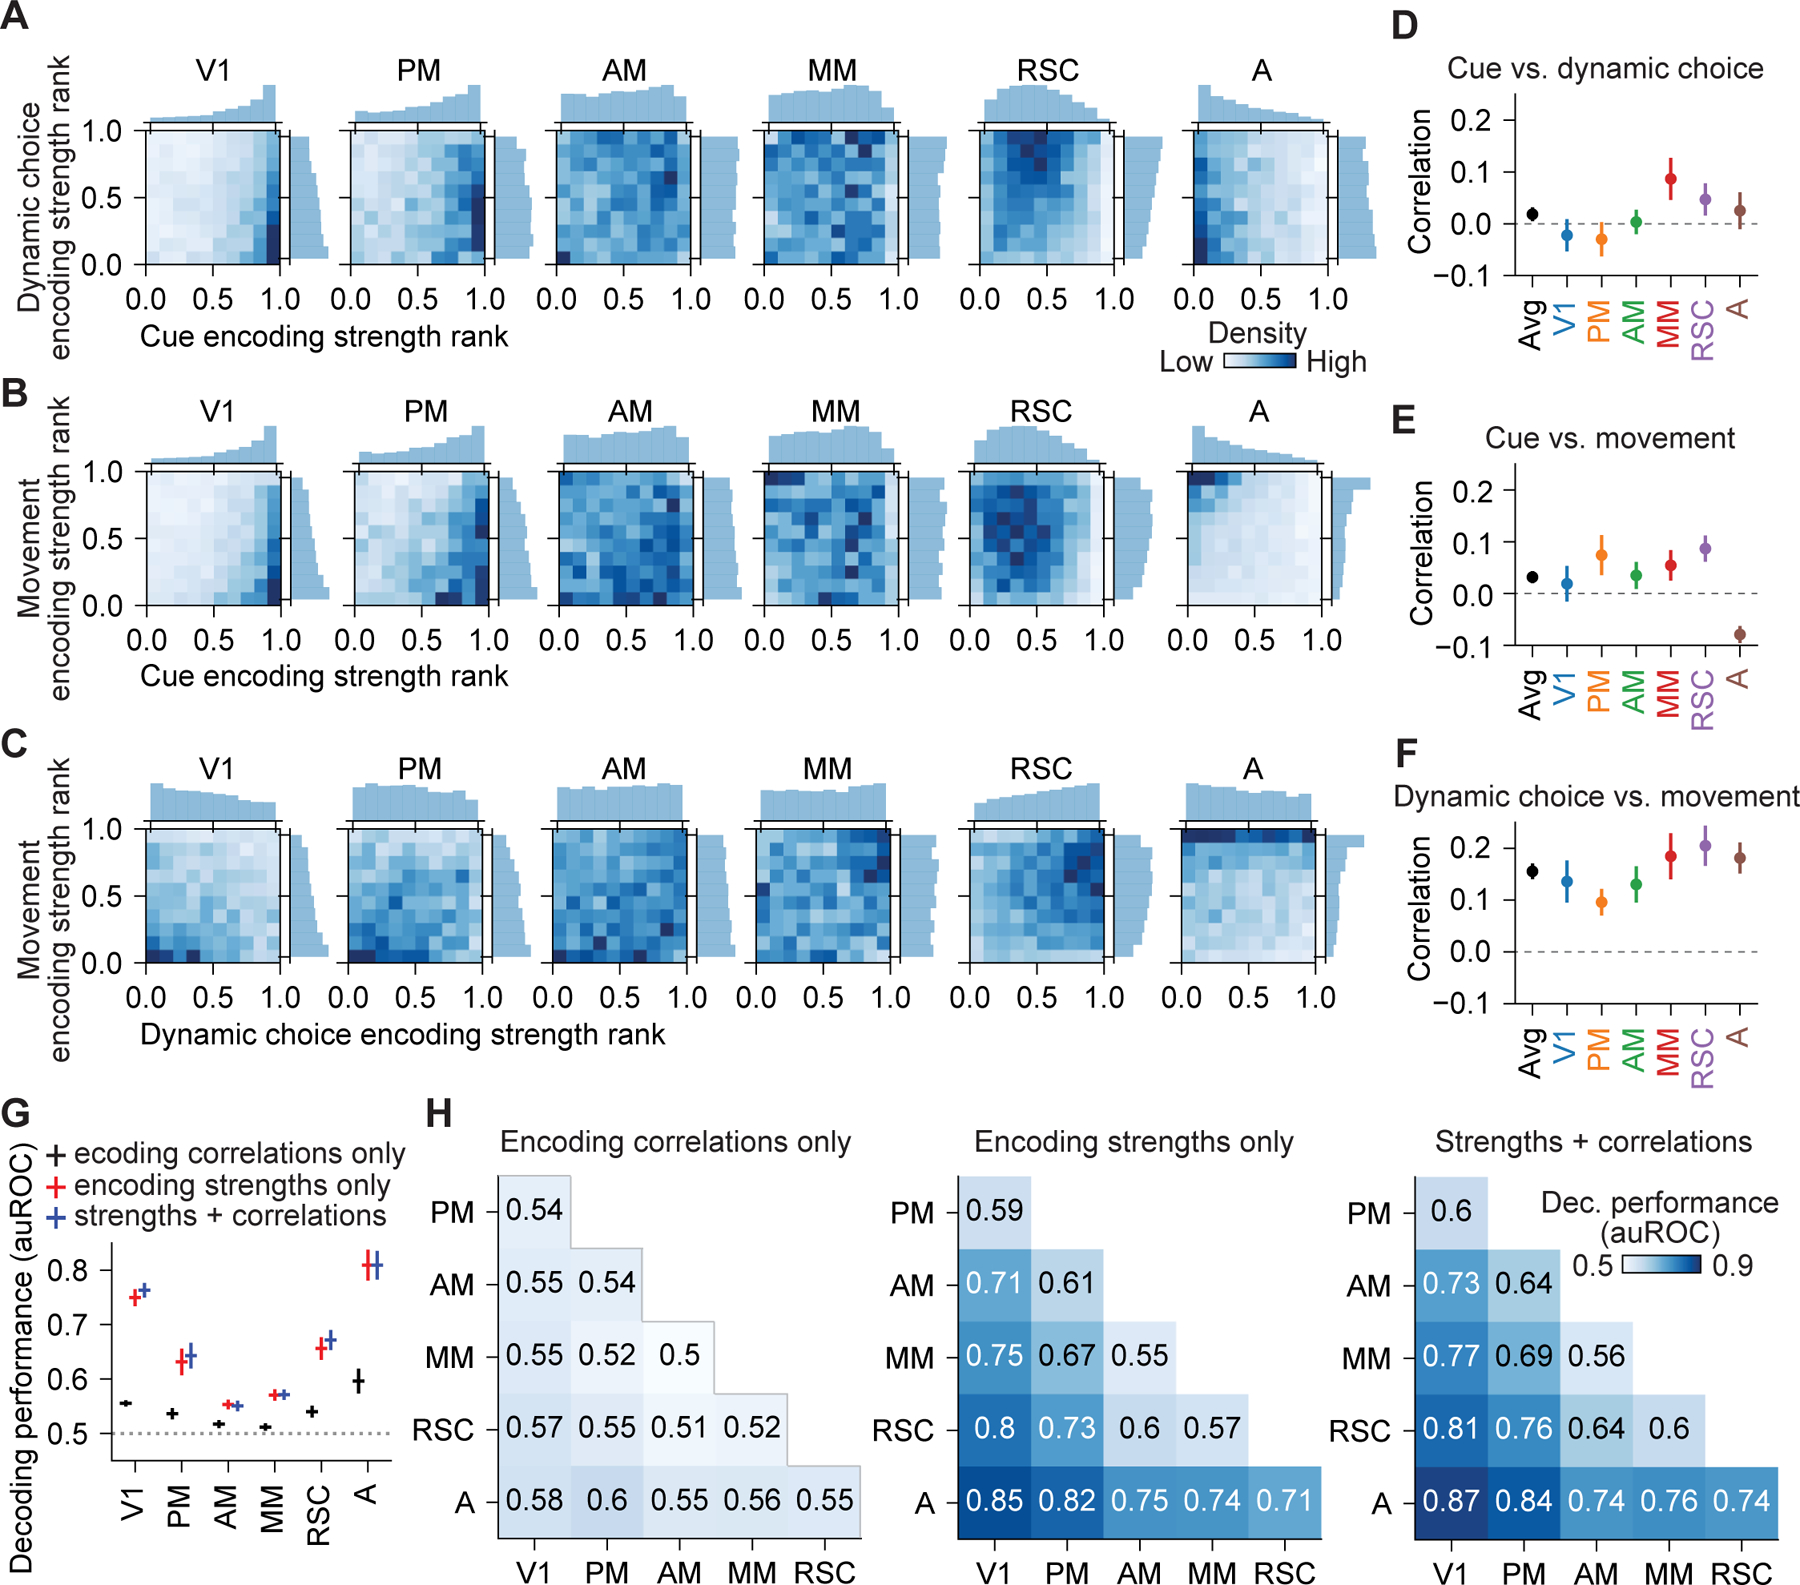
Figure 7. Quantification of encoding correlations showed generic integration.

(A) Joint and marginal distributions for encoding strength rank of cue and dynamic choice during stem traversal in 6 areas.
(B) Same as (A), but for cue and movement.
(C) Same as (A), but for dynamic choice and movement.
(D) Pearson correlation between the encoding strength of cue and dynamic choice during stem traversal for neurons in 6 areas. Bootstrap mean ± SEM. Correlations in all areas were not significantly different from one another (p > 0.05).
(E) Same as (D), but for cue and movement. A vs. each other area, p < 0.013, whereas correlations in other 5 areas were not significantly different from each other (p > 0.05).
(F) Same as (D), but for dynamic choice and movement. Correlations in all areas were not significantly different from one another (p > 0.05).
(G) Decoding performance for one-vs.-others decoders that distinguished neurons in each of the 6 areas from neurons in all other areas based on encoding correlations only, encoding strengths only, and both, during stem traversal. Mean ± SEM with leave-one-mouse-out procedure. All decoding was above chance (p < 0.05), except encoding correlations only for PM and AM. Encoding strengths only vs. encoding correlations only: p < 0.05 in all areas except for AM. Encoding strengths only vs. strengths + correlations: p > 0.03 for all areas, not significant after multiple comparison correction. Wilcoxon signed-rank test.
(H) Decoding performance for pairwise decoders that distinguished neurons in a pair of areas during stem traversal.
See also Figure S7.
