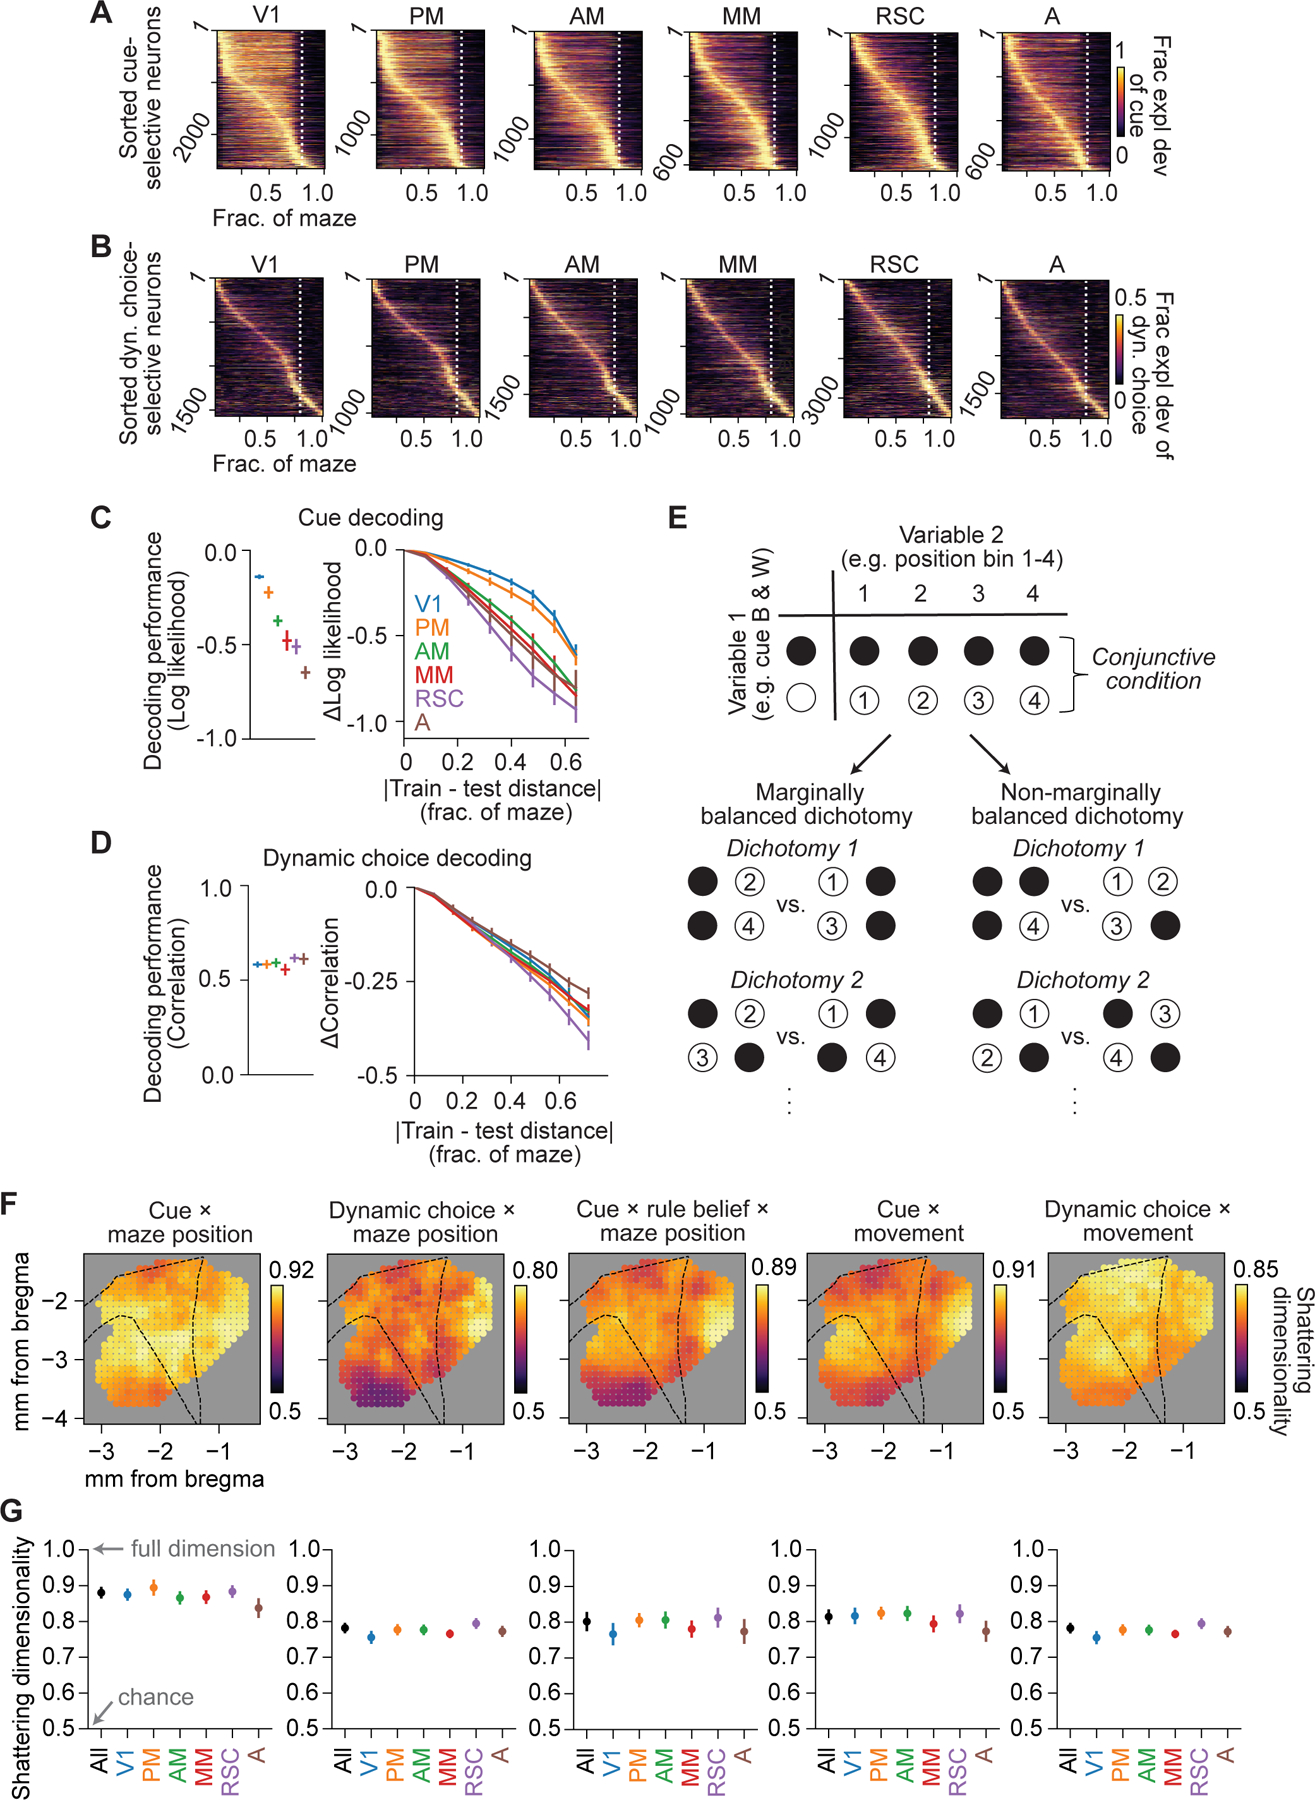
Figure 8. High dimensional representation of conjunctive variables across posterior cortex.

(A) Fraction explained deviance of cue for the top 25% cue-selective neurons across all cells, separated in 6 areas and sorted by peak location.
(B) Same as (A), except the top 25% of dynamic choice-selective neurons.
(C) Left: average decoding performance for cue based on populations of ~100 nearby neurons for 6 areas, quantified as log likelihood with log base 2. Right: change in decoding performance as a function of the distance between maze positions of the data that the decoders were trained on and tested on (restricted to positions where cue was present). n = 698 decoders.
(D) Same as (C), but for decoding performance of dynamic choice, quantified as the Spearman correlation between decoded and real values. n = 974 decoders.
(E) Schematic for identifying marginally balanced dichotomies over conjunctive conditions formed by a pair of variables.
(F) Spatial maps of shattering dimensionality (average decoding accuracy over all marginally balanced dichotomies) during stem traversal. Each dot indicates a population of 1000 nearby neurons centered on that cortical location.
(G) Shattering dimensionality based on populations of 1000 neurons subsampled from all neurons and each of the 6 areas. All datapoints were not significantly different from one another (p > 0.01, not significant after multiple comparison correction).
Data and statistics in (C), (D), (G) are presented as hierarchical bootstrap mean ± SEM.
See also Figure S8.
