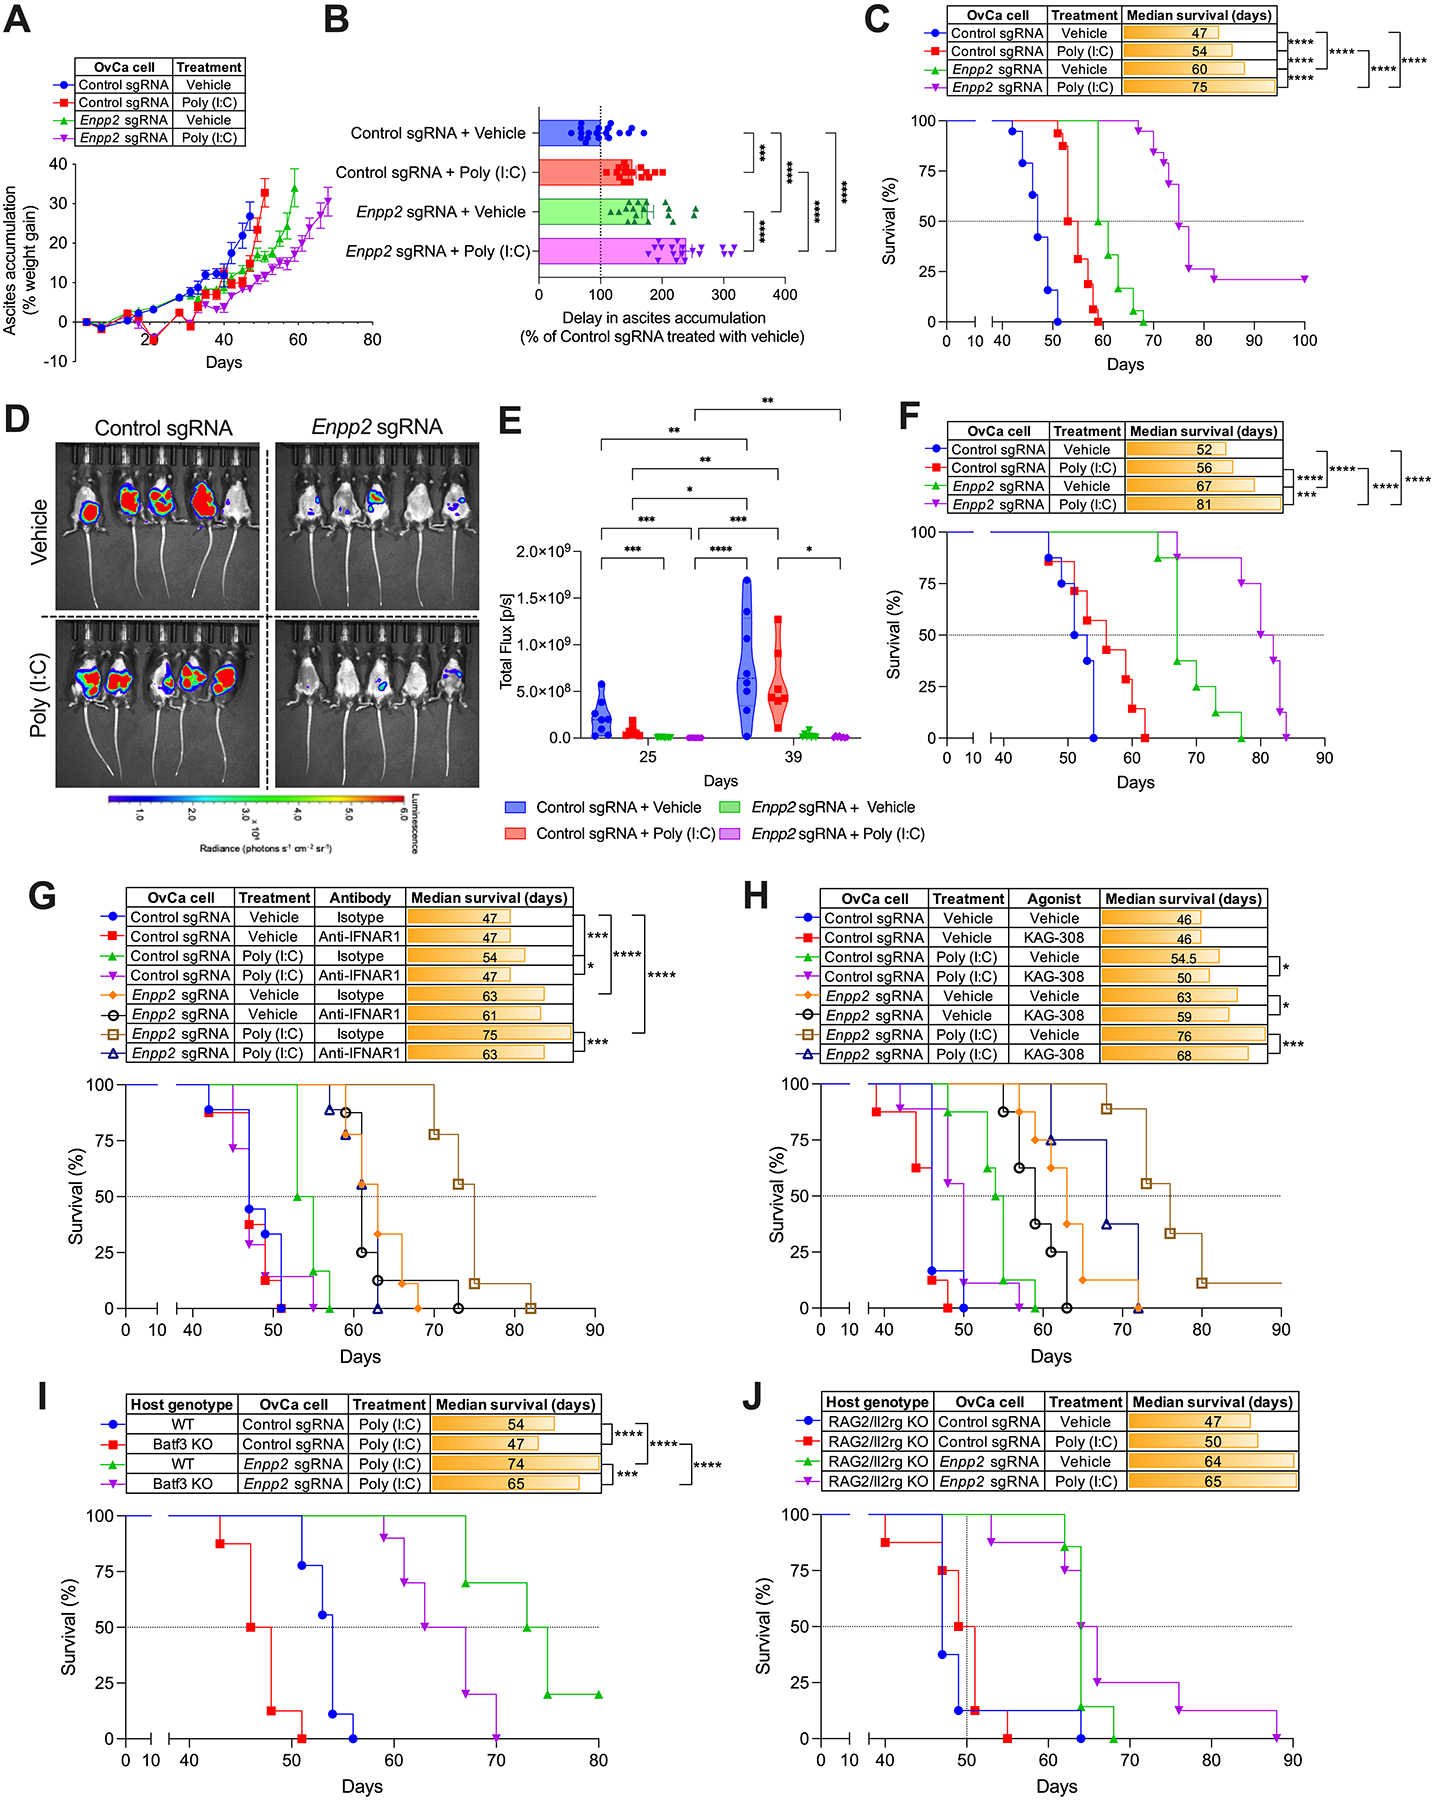
Figure 5. Therapeutic effects of Poly (I:C) administration in mice bearing ATX-null OvCa.

Wild type C57BL/6J mice were challenged i.p. with control or Enpp2-null ID8-Defb29/Vegf-A (A-C; n = 16–19 mice/group) or PPNM (D-F; n = 7–8 mice/group) cancer cells. After 10 days, mice were treated with vehicle control or Poly (I:C) as described in the methods. (A) Ascites accumulation denoted as percent weight gain over time. (B) Changes in ascites development were analyzed by calculating the area above the curve in each experimental group starting on day 21 and a cutoff of 35% of weight gain. Data are represented as percent change compared with the control sgRNA group treated with vehicle. (C) Overall survival curves for the same mice described in panels A and B. (D) Representative bioluminescent imaging at day 39 and quantification of peritoneal carcinomatosis (E) in mice bearing luciferase-expressing control or Enpp2-null PPNM tumors for 25 and 39 days with or without Poly (I:C) treatment. (F) Overall survival curves for the same mice described in panels D and E. (G) Experiments were repeated as in A-C, but 3 days after tumor implantation mice (n = 6–9/group) were treated with isotype control or anti-IFNAR1 blocking antibodies, as described in the methods. Host survival was monitored over time. (H) Experiments were repeated as in A-C, but 9 days after tumor implantation mice (n = 6–9/group) were orally treated with vehicle control or the EP4 agonist KAG-308 as described in the methods. Host survival was monitored over time. (I) Overall survival in mice of the indicated genotypes implanted with control or Enpp2-null ID8-Defb29/Vegf-A OvCa treated with Poly (I:C) (n = 8–10/group). (J) Overall survival in Rag2/Il2rg double knockout mice implanted with control or Enpp2-null ID8-Defb29/Vegf-A OvCa receiving the indicated treatments (n = 7–8/group). Data in A and B are shown as mean ± SEM. (B), One-Way ANOVA with Tukey’s multiple comparisons test. (E), Two-way ANOVA (Tukey’s multiple comparisons test). (C, F, G, H, I and J), Log-rank test for survival. *P<0.05, **P<0.01, ***P<0.001, ****P<0.0001.
