
Figure 3. CAR-T cells of poor responders are enriched in an exhaustion-like phenotype post-infusion that includes high TIGIT expression.
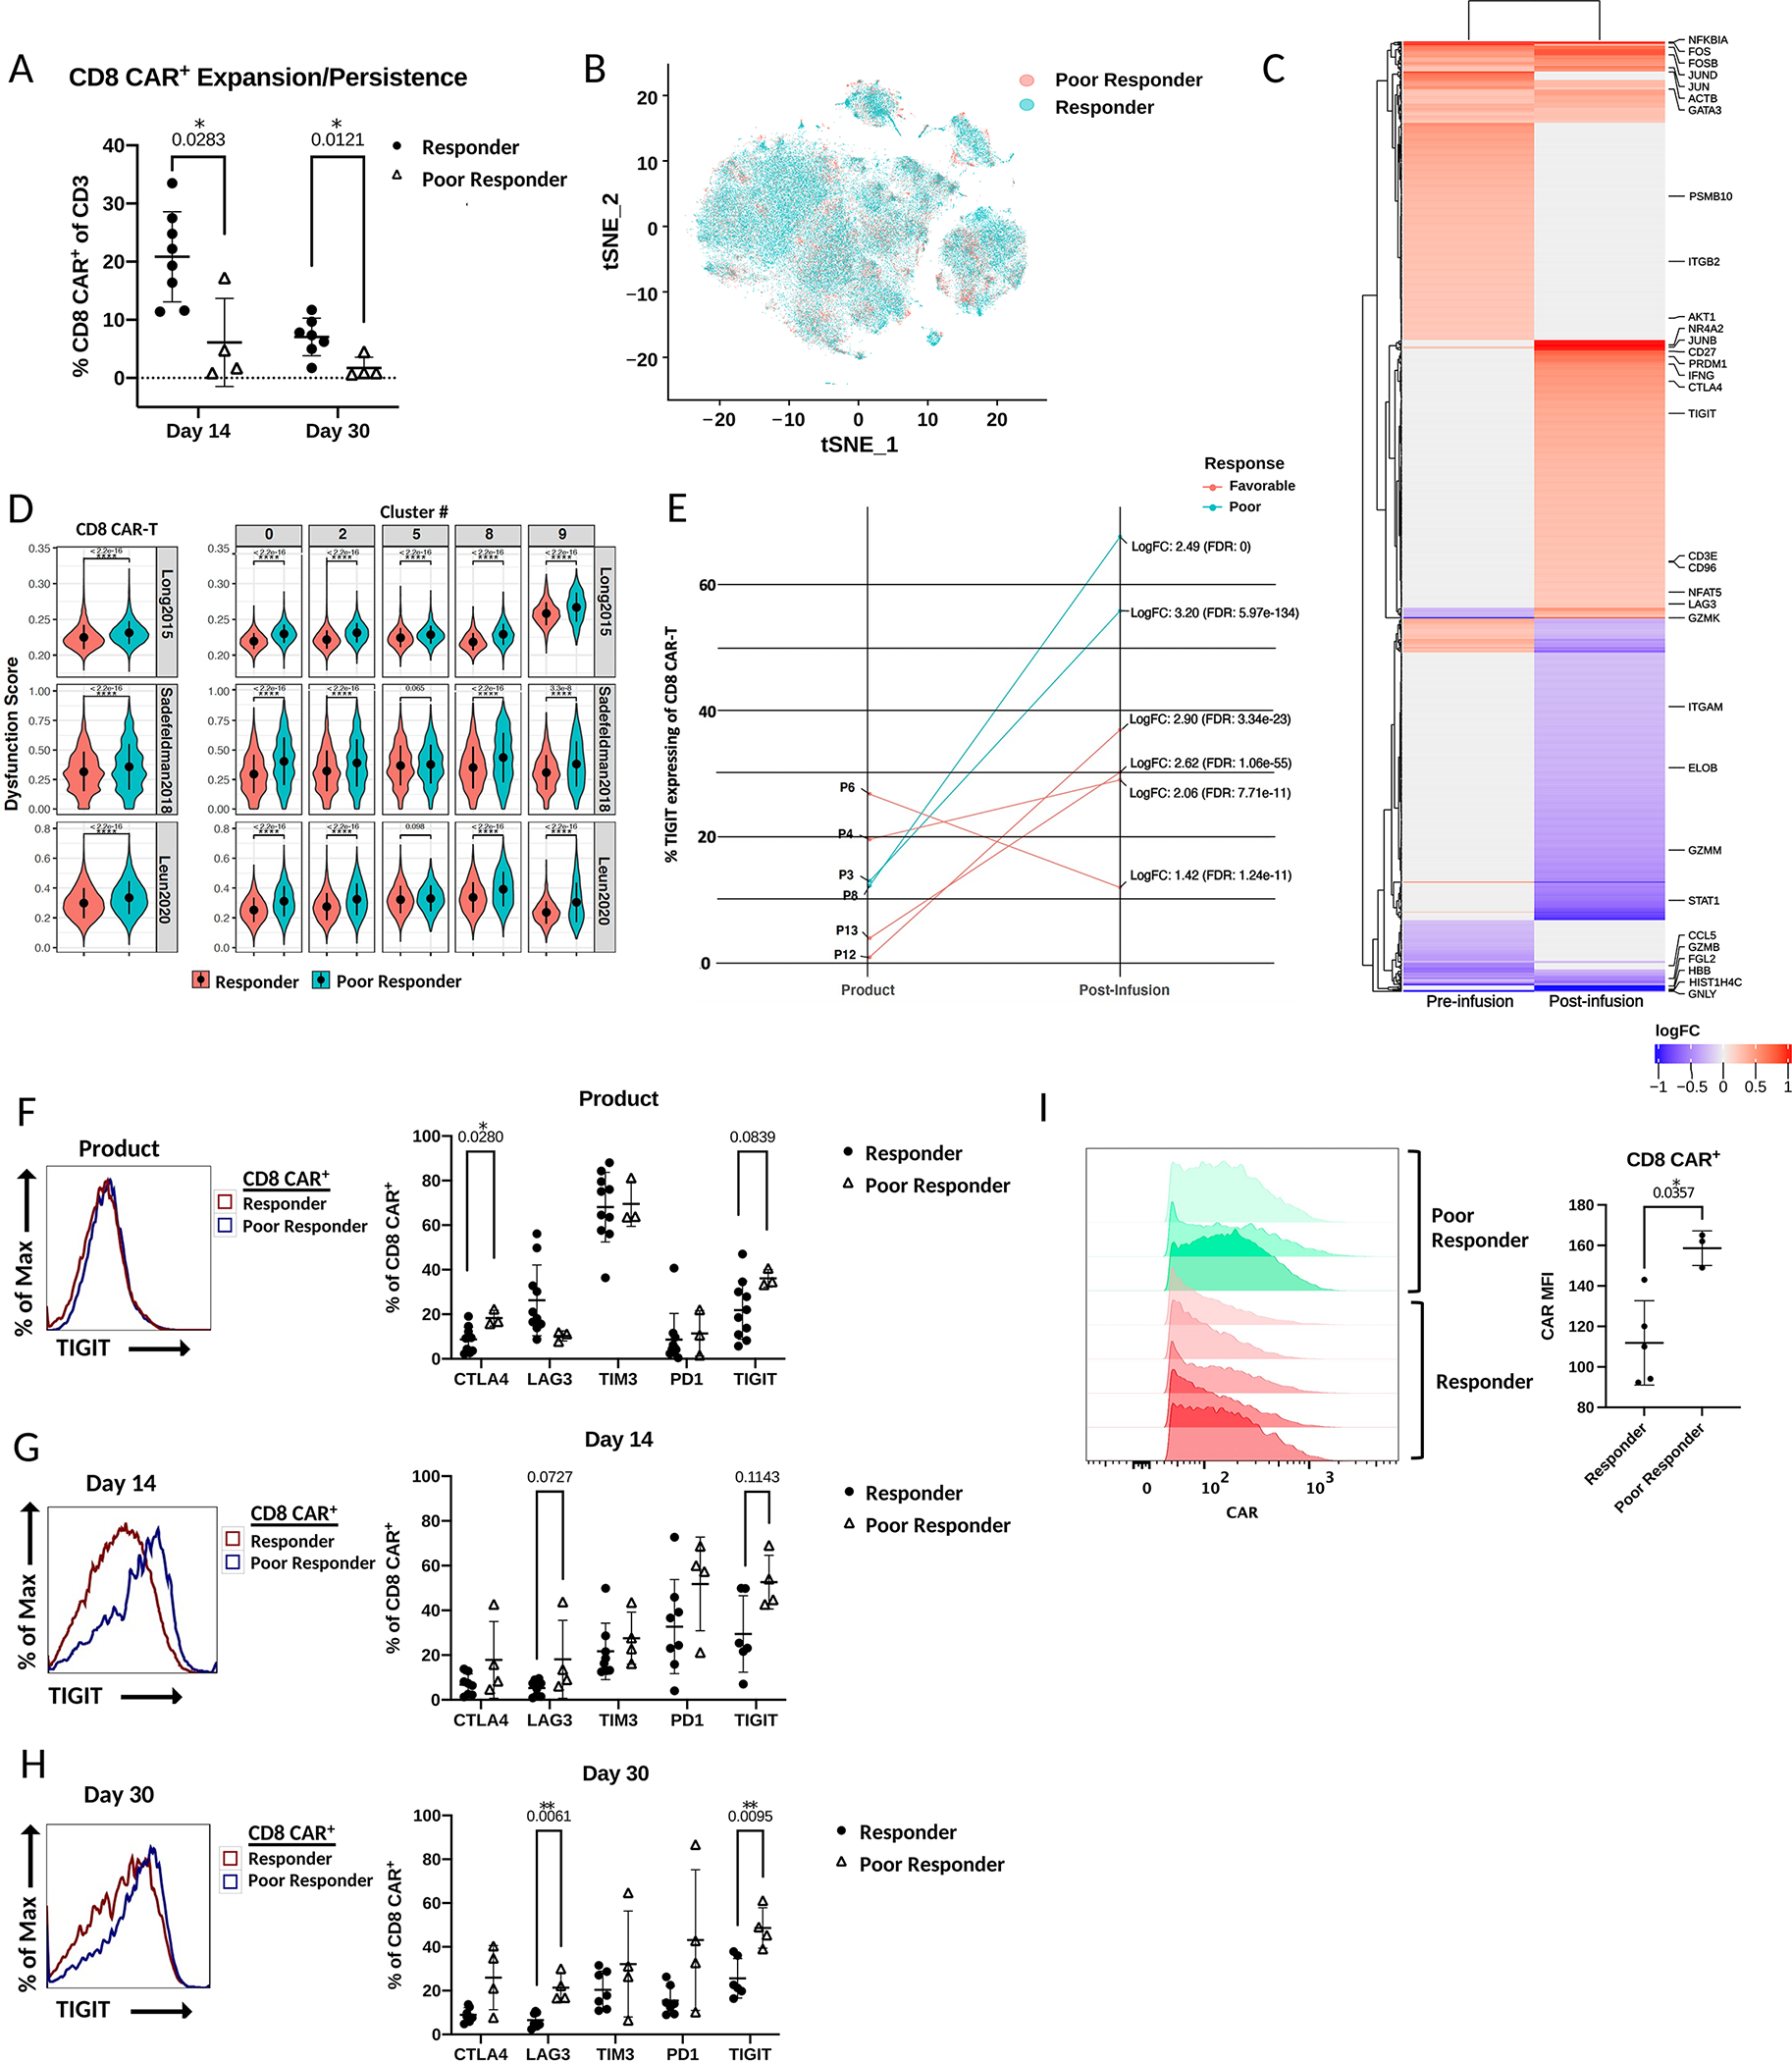
A) Percentage of CD8 CAR-T cells of total T cells between patient response groups at day 14 and day 30 post-infusion as measured by flow cytometry (comparison by Wilcoxon matched-pairs signed rank test). B) scRNA tSNE dimension reduction with patient response group overlay. C) Heatmap of immunoregulatory genes that are differentially expressed (adjusted p-value < 0.05; zlm) between CD8 CAR-T cells of the different response groups before infusion and after infusion. Color represents log fold increase/decrease in poor responders. D) Violin plot comparison of CAR-T cell dysfunction scores between response groups with three exhaustion gene sets by Wilcoxon rank-sum test. Left – comparison of total CD8 CAR-T cells between response groups. Right – comparison of CD8 CAR-T cells between response groups within the most predominant clusters. E) Comparison between individual patients and response groups with zlm by R package MAST of the percentage of TIGIT expressing CD8 CAR-T cells before and after infusion. Average log fold change refers to read counts. F-H) Left – Histograms of fluorescence intensity of TIGIT between response groups as measured by flow cytometry. Each curve represents a concatenation of all samples with equal proportions of CD8 CAR-T cells from each sample. Right – Comparison between patient response groups of the percentage of CD8 CAR-T cells expressing the checkpoint receptors CTLA4, LAG3, TIM3, PD1, or TIGIT by Mann-Whitney tests as measured by flow cytometry. I) Comparison of CAR expression in CD8 CAR-T cells of the product between responders and poor responders. Statistical comparison by Mann-Whitney test.