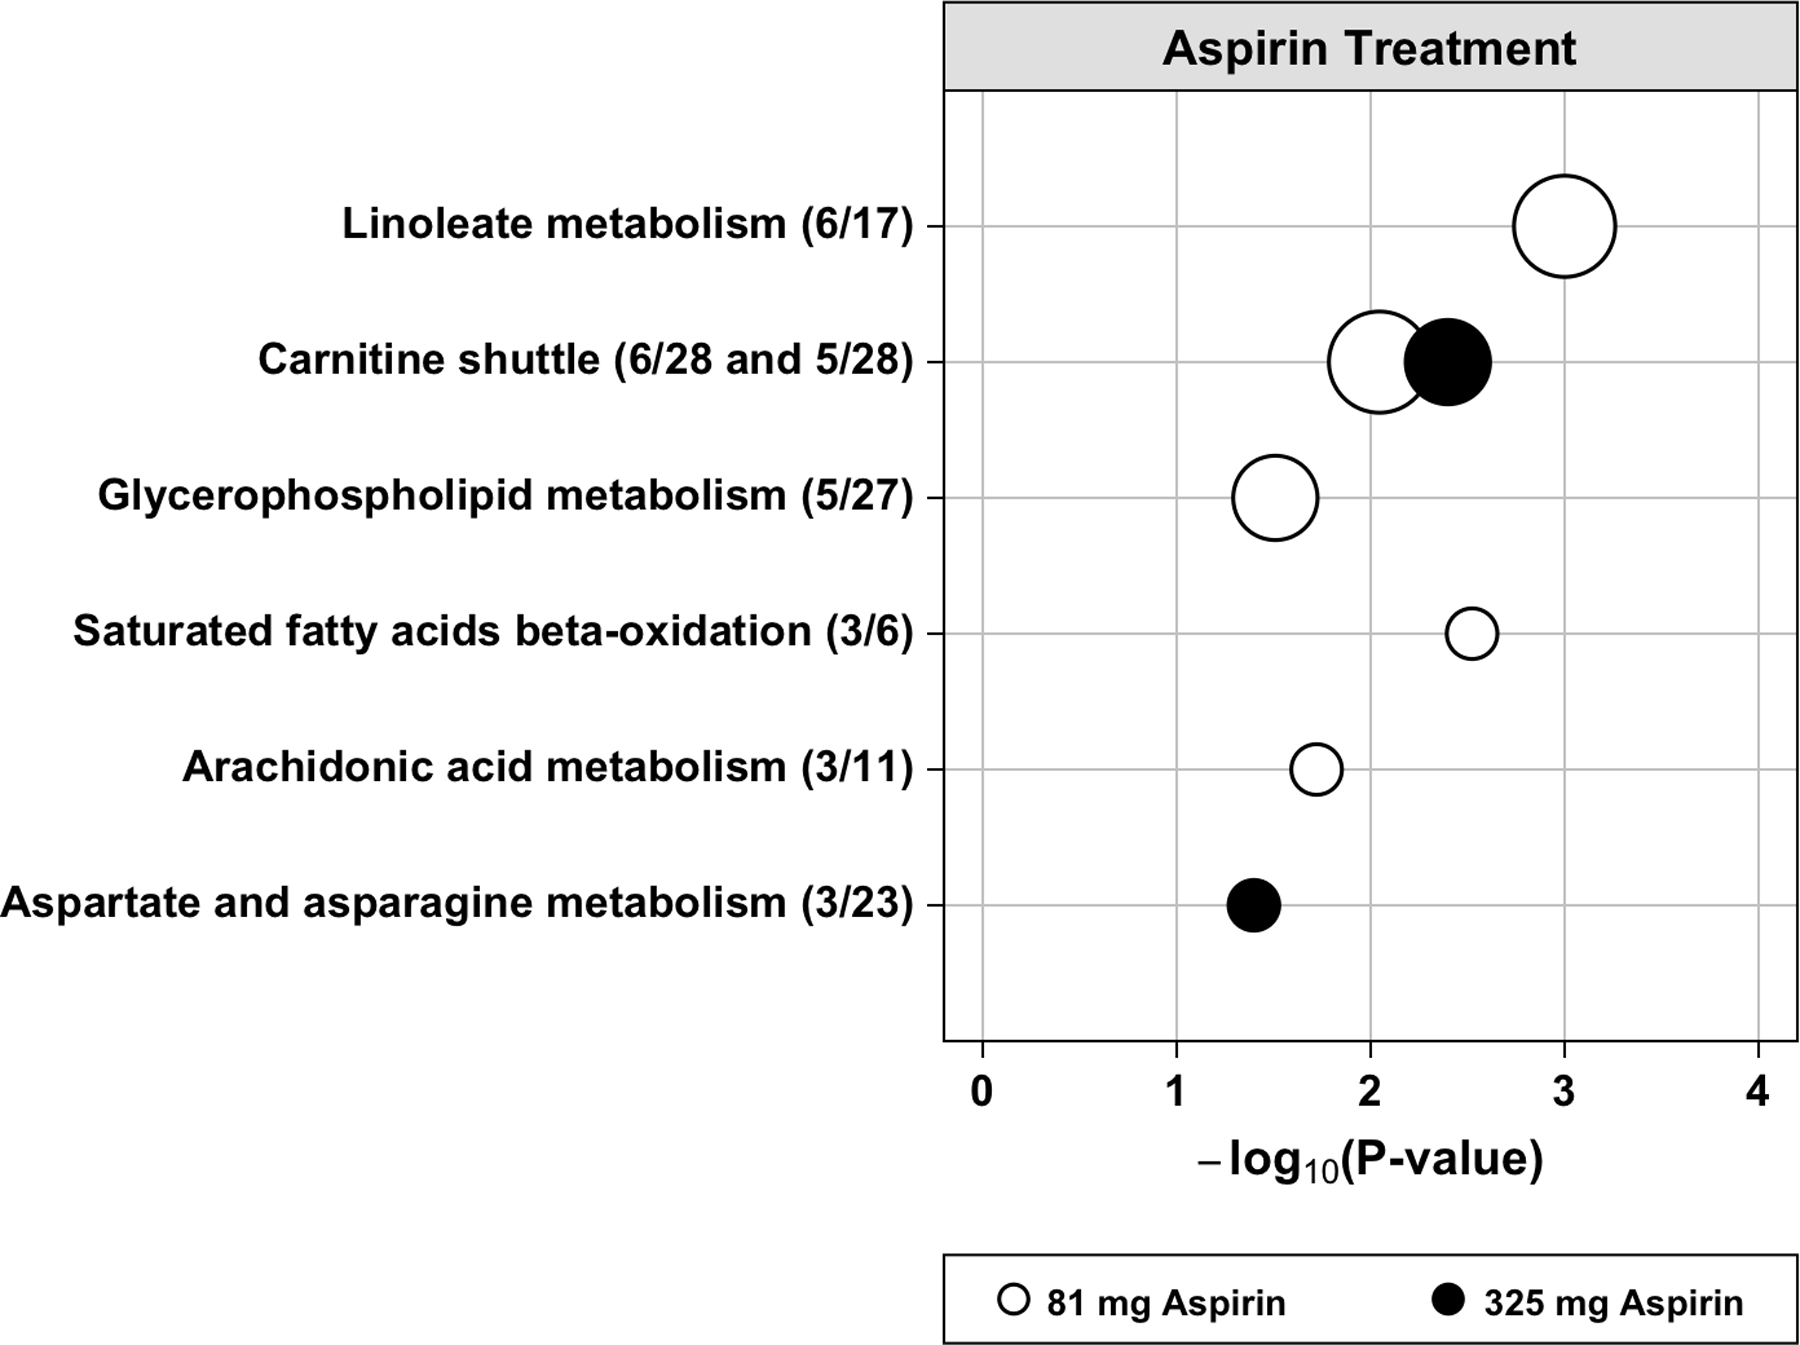
Figure 3.

Dysregulated metabolic pathways associated with aspirin treatment in blood plasma in run 1. The vertical axis represents the pathways (circles) with the radius representing the number of hits (significant metabolic features). The horizontal axis represents the negative log10 of the gamma adjusted P-values for each pathway with at least 3 hits. The open circles are for 81 mg aspirin and the solid circles are for 325 mg aspirin treatment. In parentheses next to each pathway name is the number of hits divided by the pathway size (total number of features detected in the pathway).
