
Figure 3.
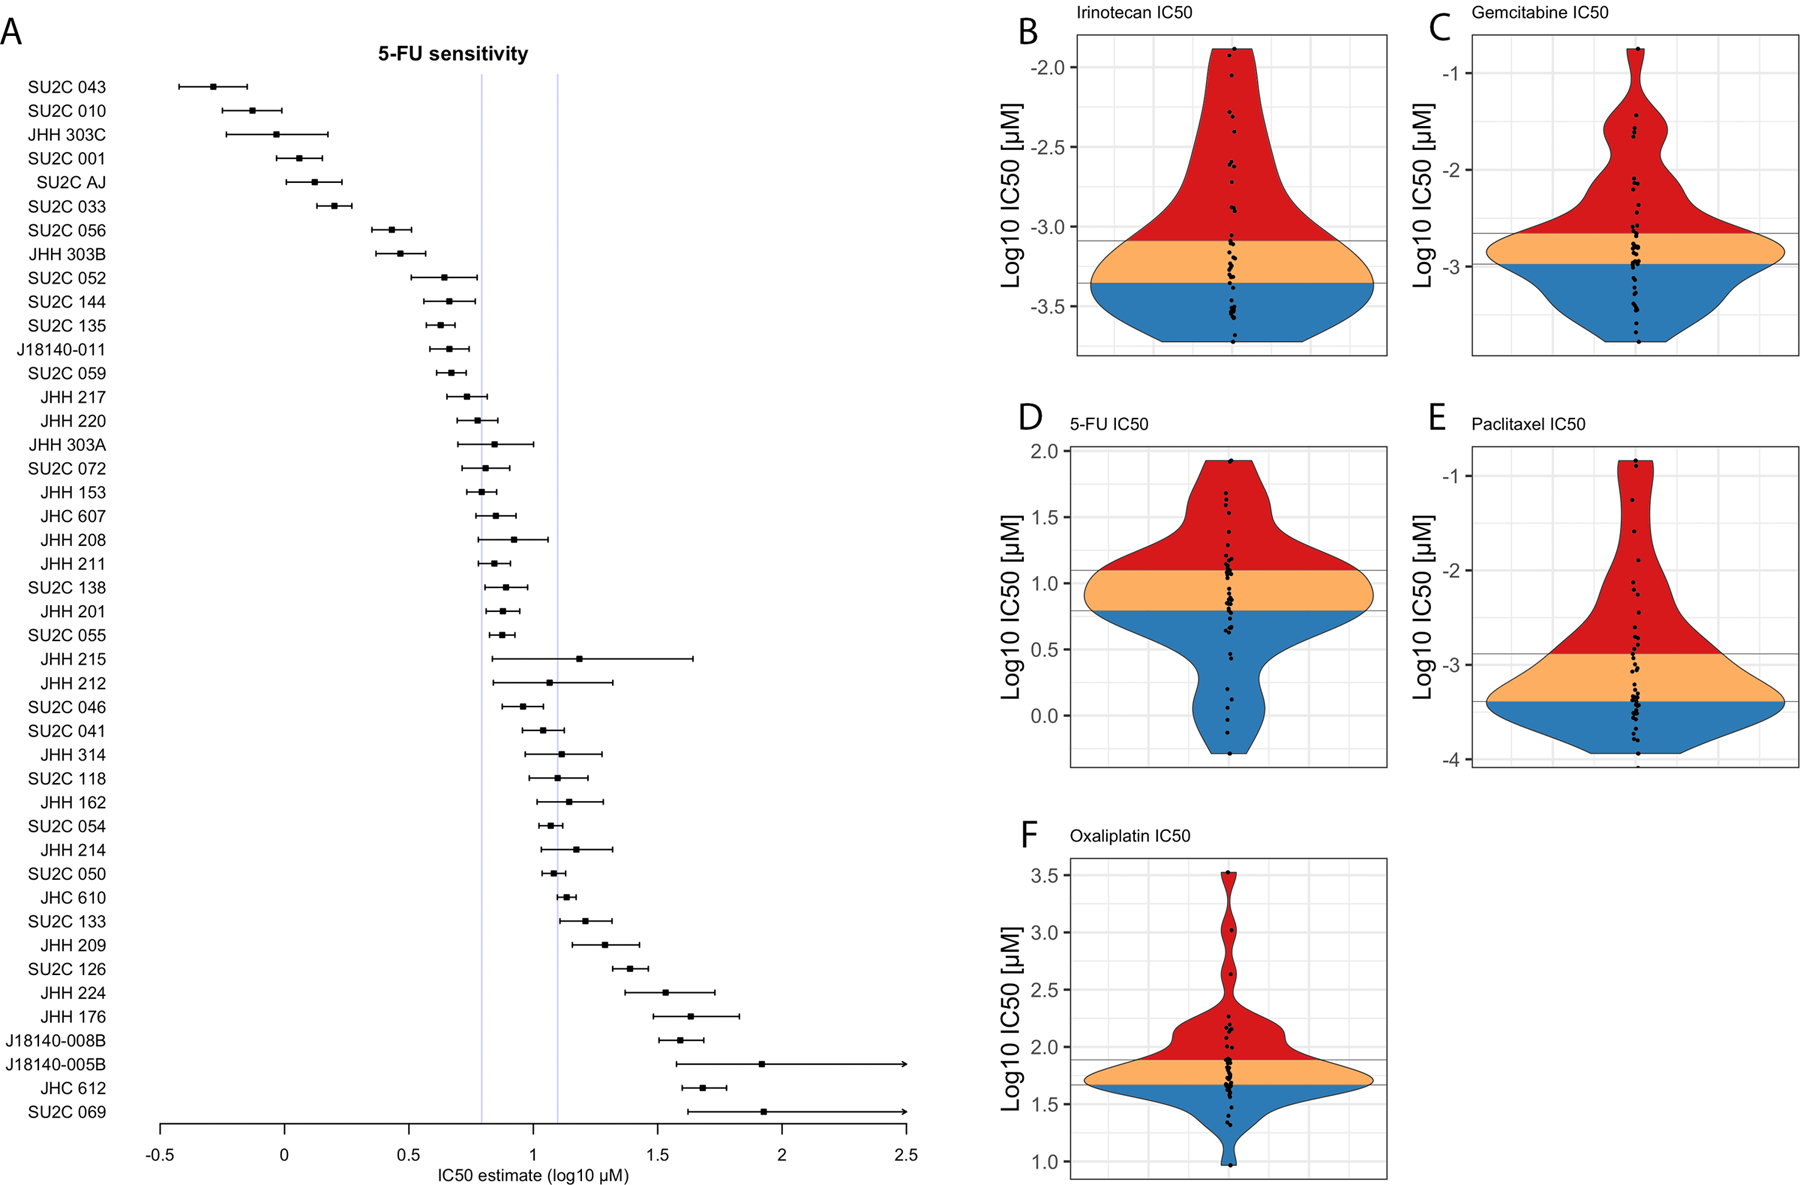
Pharmacotyping-derived population distribution of PDOs (left axis label) showing half maximal inhibitory concentration (IC50) and 95% confidence interval in dose-response testing against 5-fluorouracil (5-FU (A). A population distribution of mean PDO IC50 values presented as a violin plot for Irinotecan (B), 5-FU (C), Oxaliplatin (D), Gemcitabine (E) and Paclitaxel (F). Putative clinically-relevant cohorts are categorized in thirds as sensitive (blue), intermediate (orange) and resistant (red) to the chemotherapeutic described.