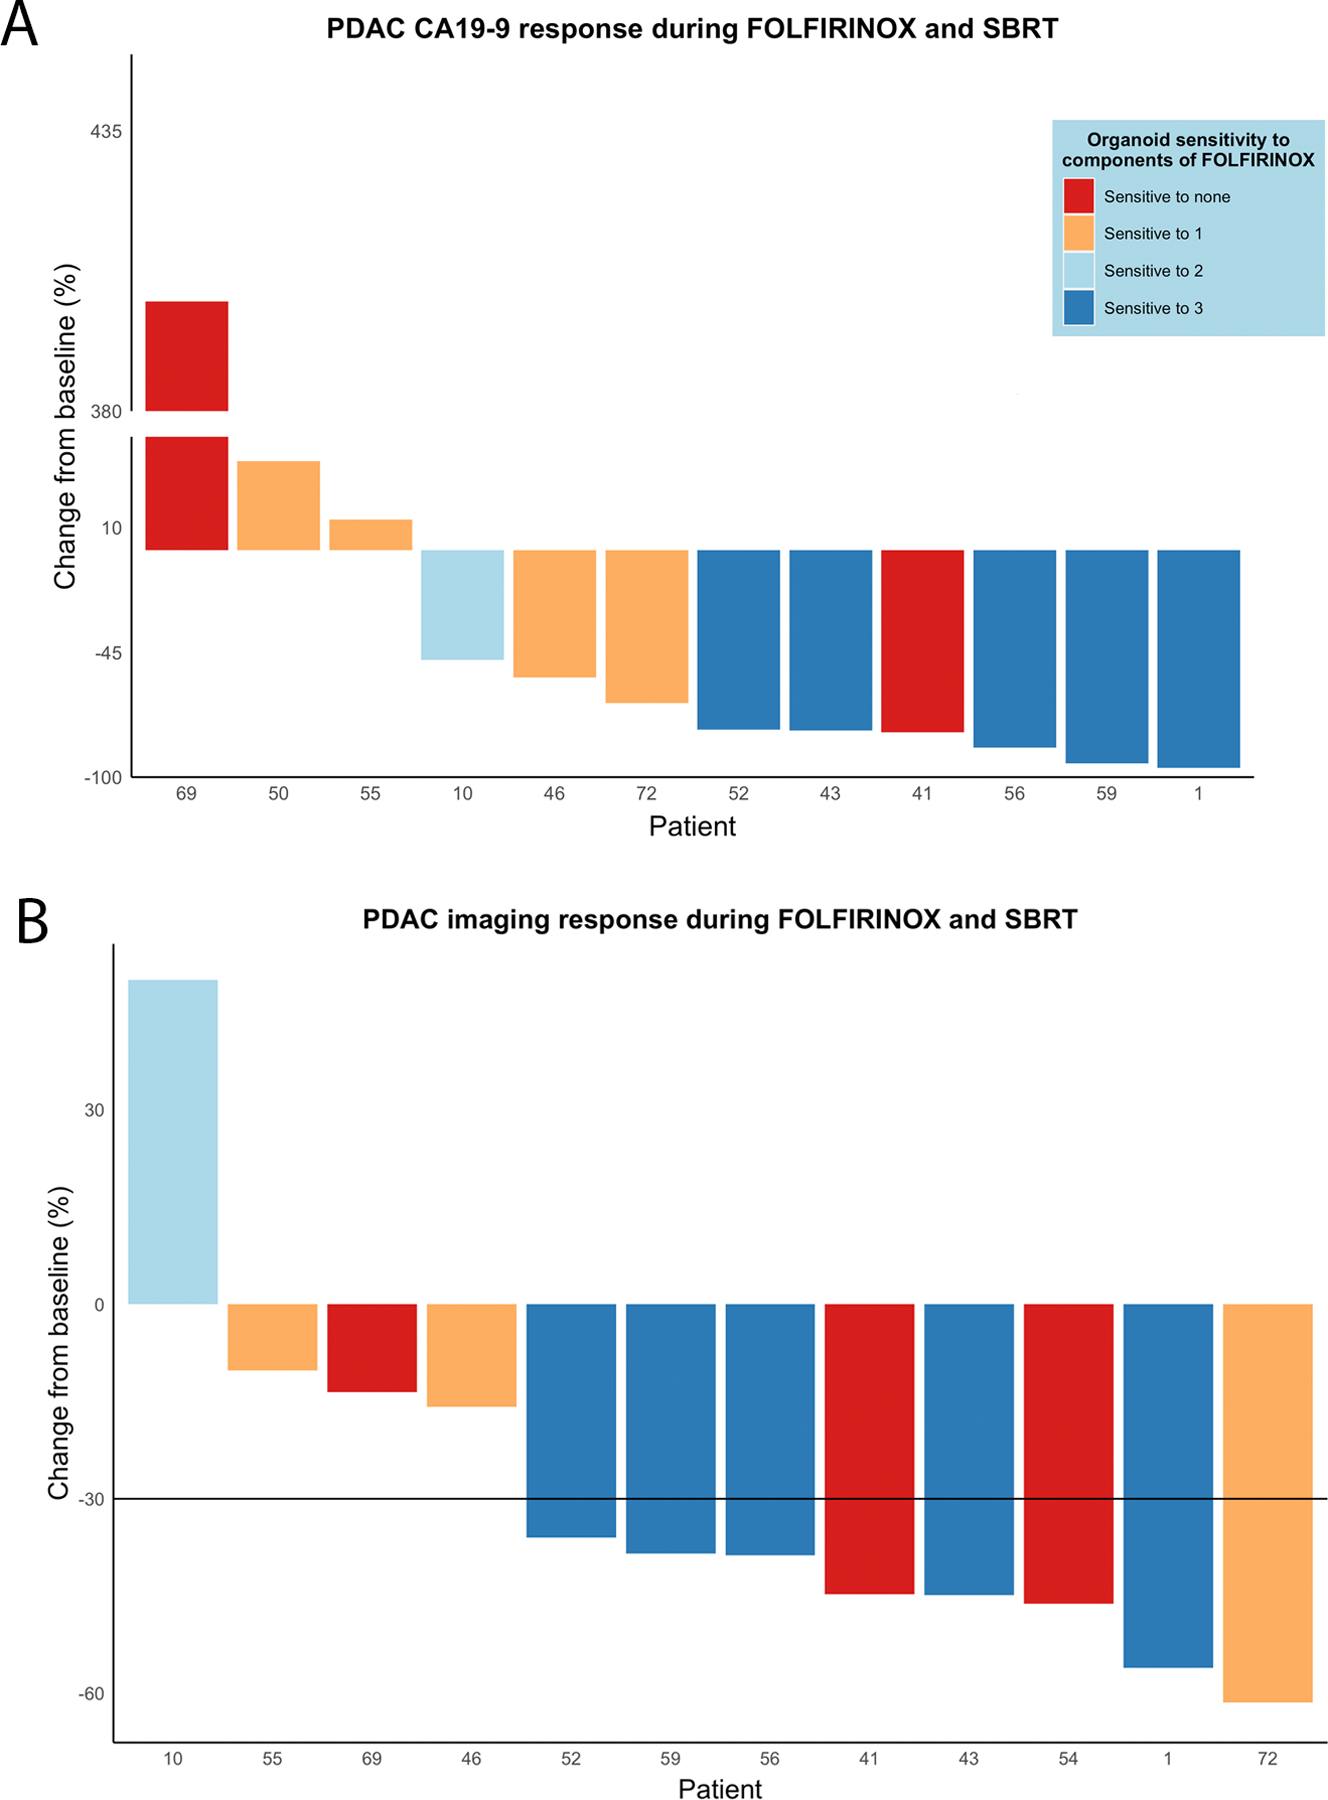
Figure 5.

A waterfall plot showing patients’ CA19–9 responses to FOLFIRINOX as percentage change during the time period of neoadjuvant therapeutic administration (A). Only patients clearly producing plasma CA19–9 were included, whereas one patient with a CA19–9 baseline level of 3 U/mL was excluded. Sensitivity of the patients’ organoid in single agent pharmacotyping to each three compounds of FOLFIRINOX are presented by colors of the bar: dark blue = sensitive to all three drugs, light blue = sensitive to two drugs, orange = sensitive to one drug, and red = sensitive to none of the three drugs. Waterfall plot presenting the tumor volume change in computed tomography imaging (RECIST response) during the period of neoadjuvant therapy (B).
