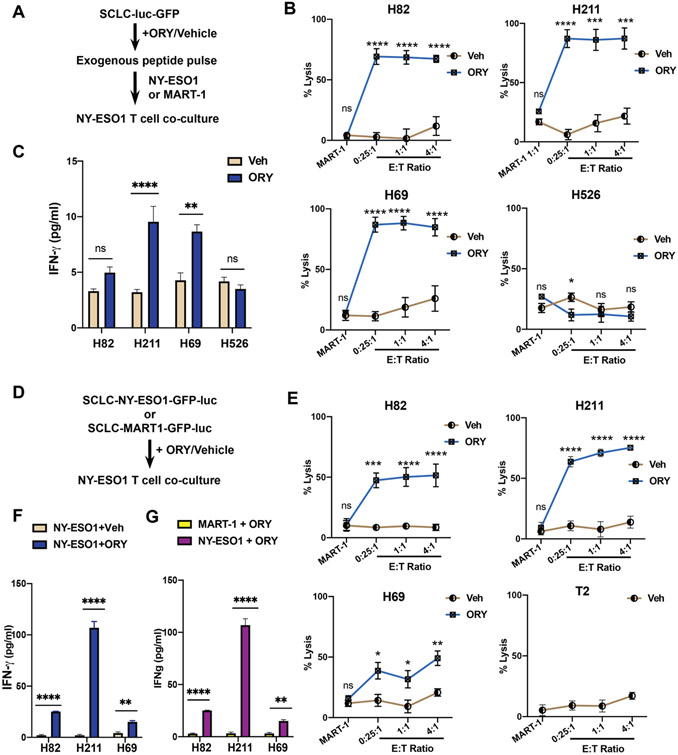
Figure 4: LSD1 inhibition sensitizes SCLC cells to T cell-mediated cytotoxicity.
(A) Workflow of T cell co-culture experiment with pulsed peptides. H82, H211, H69 and H526 expressing luciferase were treated with either 1μM ORY-1001 or vehicle for 10 days before short-term exposure to NY-ESO1 or MART-1 peptides (5μ/ml). NY-ESO1-reactive CD8+T cells were introduced at specific effector-to-target (E:T) ratio and co-incubated for 18 hours. (B) Luciferase assay was performed to determine the percentage of live cells remaining in each co-culture condition compared to control samples without effector cells. For cells pulsed with NY-ESO-1 antigens values were calculated at 0.25:1, 1:1 and 4:1 ratios. Cells pulsed with MART-1 antigen were co-cultured at a 1:1 ratio with NY-ESO-1+ CD8+ T cells. (C) Levels of human IFN-γ present in the culture media after co-incubation period were quantified using ELISA. (D) Workflow of T cell co-culture experiment with endogenous peptides. H82, H211, H69 and T2 cells expressing either NY-ESO1-luciferase or MART-1-luciferase were treated with either 1μM ORY-1001 or vehicle for 10 days before NY-ESO1 TCR+ CD8+ T cells were introduced at specific effector-to-target (E:T) ratio and co-incubated for 18 hours. (E) Percentage of live cells remaining in each co-culture condition compared to control samples without effector cells were assessed using a luciferase assay. For cells pulsed with NY-ESO1, cells were plated at 0.25:1, 1:1 and 4:1 E:T ratios. Cells pulsed with MART-1 antigen were co-cultured in 1:1 ratio with NY-ESO-1 TCR+ CD8+ T cells. T2 cells, which lack TAP transporters and express an empty HLA-A*02:01 on the cell surface, served as a negative control. (F-G) Levels of human IFN-γ present in the culture media after co-incubation period were quantified using ELISA. Comparison between treatment conditions was assessed in NY-ESO1-expressing cells lines in (F) or in MART-1- and NY-ESO1 expressing cells treated with 1μM ORY-1001 (G).

