
Figure 2. CITIs are Formed around FC and DFC in Nucleoli.
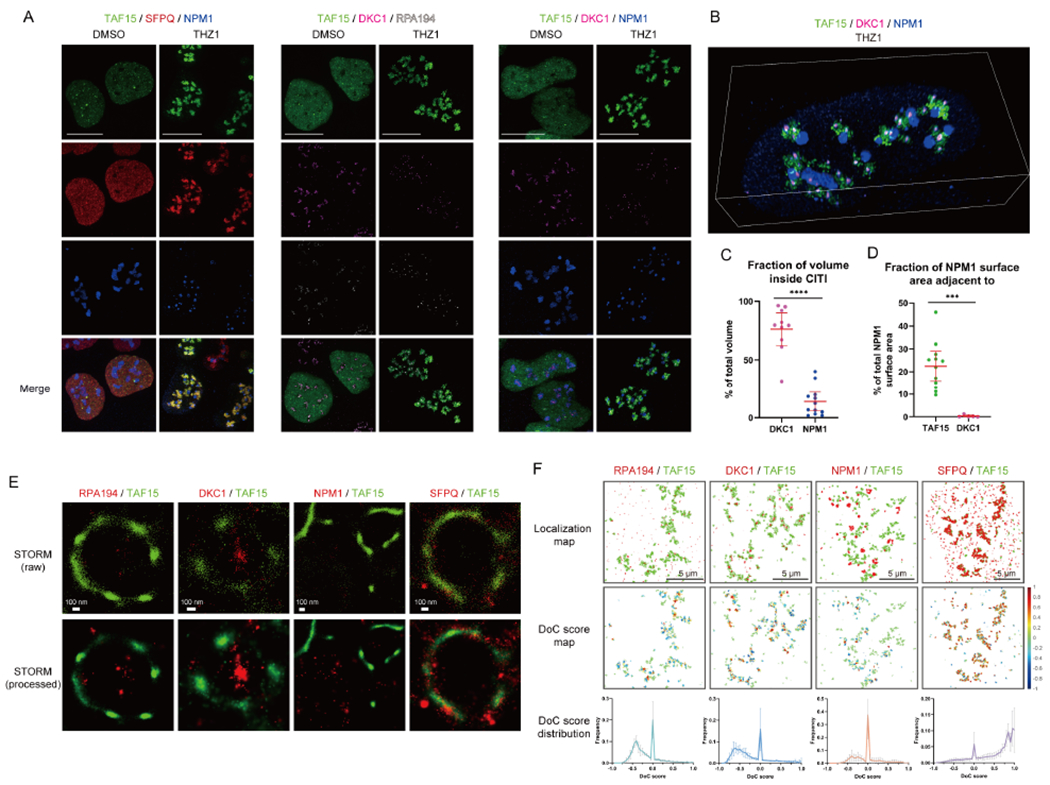
U2OS cells expressing GFP-TAF15 were untreated or treated for 1 hr with THZ1 and stained for GFP-TAF15 (green) and two other proteins associated with different nucleolar compartments or SFPQ.
(A) Three-color SoRa imaging of representative cells. The color of each protein is shown on the top. Scale bar, 5 μm.
(B) SoRa volumetric renderings of z-stacks of a single representative nucleus. Green, TAF15; magenta, DKC1; blue, NPM1. See also Video 3 and Figure S2M.
(C, D) The DKC1 or NPM1 fraction of volume inside CITIs (C) and fraction of NPM1 surface area adjacent to TAF15 or DKC1 (D) were quantified from the SoRa volumetric renderings.
(E) Two-color STORM imaging of representative CITIs. Top row shows the individual localizations for each channel as points. Bottom row shows the reconstructed image. Scale bar, 100 nm.
(F) Map of localizations of each channel for a representative region of interest (ROI) for Clus-DoC analysis (top row). Map of degree of GFP-TAF15 localizations in the ROI colored by DoC score (middle row). Distribution of DoC scores for GFP-TAF15 to the other channel across 4-6 nucleolar regions per sample (bottom row, mean with SD, n=4-6). Scale bar, 5 μm.