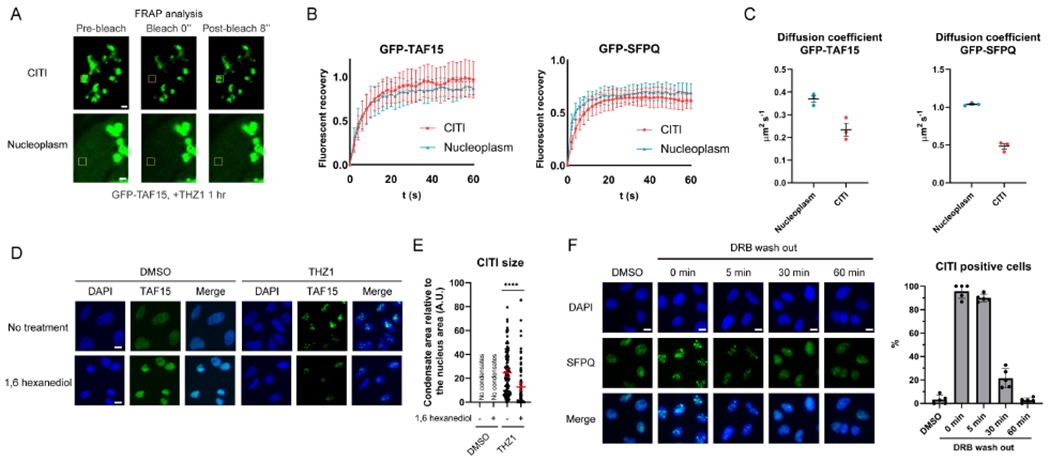
Figure 3. CITI is a Dynamic Structure.

(A) Representative images from the FRAP analysis of THZ1-treated GFP-TAF15 expressing cells. The bleached area is indicated with a yellow square. Scale bar, 1 μm.
(B) The relative fluorescent recovery of GFP-TAF15 or GFP-SFPQ after bleaching of condensates (CITIs) or diffused areas (nucleoplasm) was analyzed (mean with SD, n=10 or 11 for data points of the cells from each category, representative results from three biological replicates). The fitted curves for each category are shown as a dotted line.
(C) The diffusion coefficient was calculated from the FRAP analysis (mean with SEM, n=3 for data points of three biological replicates).
(D, E) The effect of 1,6-hexanediol treatment (1.5%, 15 min) on TAF15 in CITIs was analyzed by IF (D). Scale bars, 10 μm. Since the nuclear size was shrunk by 1,6-hexanediol treatment, the size of CITIs was normalized to the nucleus size (E). The results are shown as mean with 95% CI.
(F) The effect of DRB wash out on CITIs was analyzed by IF. Scale bars, 10 μm. The quantification of CITI positive cells at each time point is shown.
