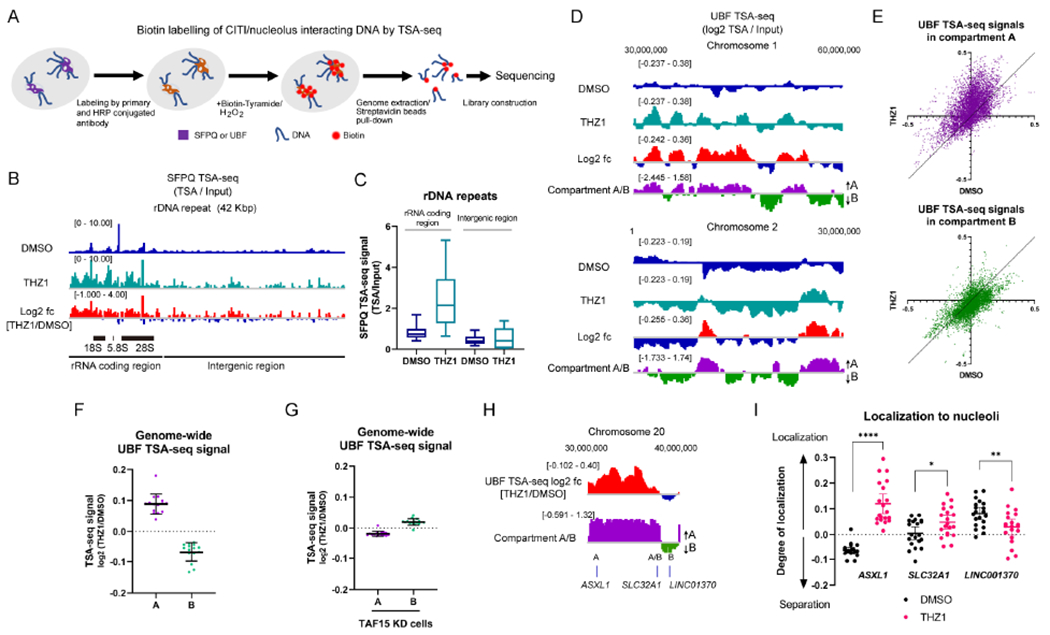
Figure 5. CITIs Localize Active Chromatin to Nucleoli upon RNAPII Inhibition.

(A) The experimental scheme of the SFPQ/UBF TSA-seq.
(B, C) The genome view of SFPQ TSA-seq at the rDNA repeat unit aligned with the log 2 ratio of THZ1 and DMSO (log2 fc) (B). The quantification of signals at the rRNA coding region and intergenic region within the repeat unit is shown in (C). Representative results from two biological replicates are shown.
(D) Two representative genome views of UBF TSA-seq aligned with Compartment A/B prediction scores. The log 2 ratio of THZ1 and DMSO is also aligned. The TSA-seq signals were smoothed in a 1-Mb window so that the scale of changes fitted with that of the Compartment A/B profile. Representative results from two biological replicates are shown.
(E, F) The effect of THZ1 treatment on the genome-wide UBF TSA-seq signals were analyzed with the scatter plots (DMSO vs THZ1) (E) or the dot plots of the log2 ratio of THZ1 and DMSO (mean with SD, n=15 for data points from individual chromosomes) (F) in either Compartment A or B.
(G) The genome-wide UBF TSA-seq signals in TAF15 KD cells at either Compartment A or B were quantified as in (F).
(H, I) The log2 ratio of UBF TSA-seq signals (THZ1/DMSO) and compartment A/B prediction scores at ASXL1, SLC32A1, and LINC01370 (H). Colocalization between these gene loci and the DFC region of nucleoli identified by DKC1 were analyzed by FISH in untreated and THZ1-treated cells (I). The degree of localization was calculated by the divergence from background frequency and compared (mean with 95% CI, n=20 for data points from two biological replicates).
