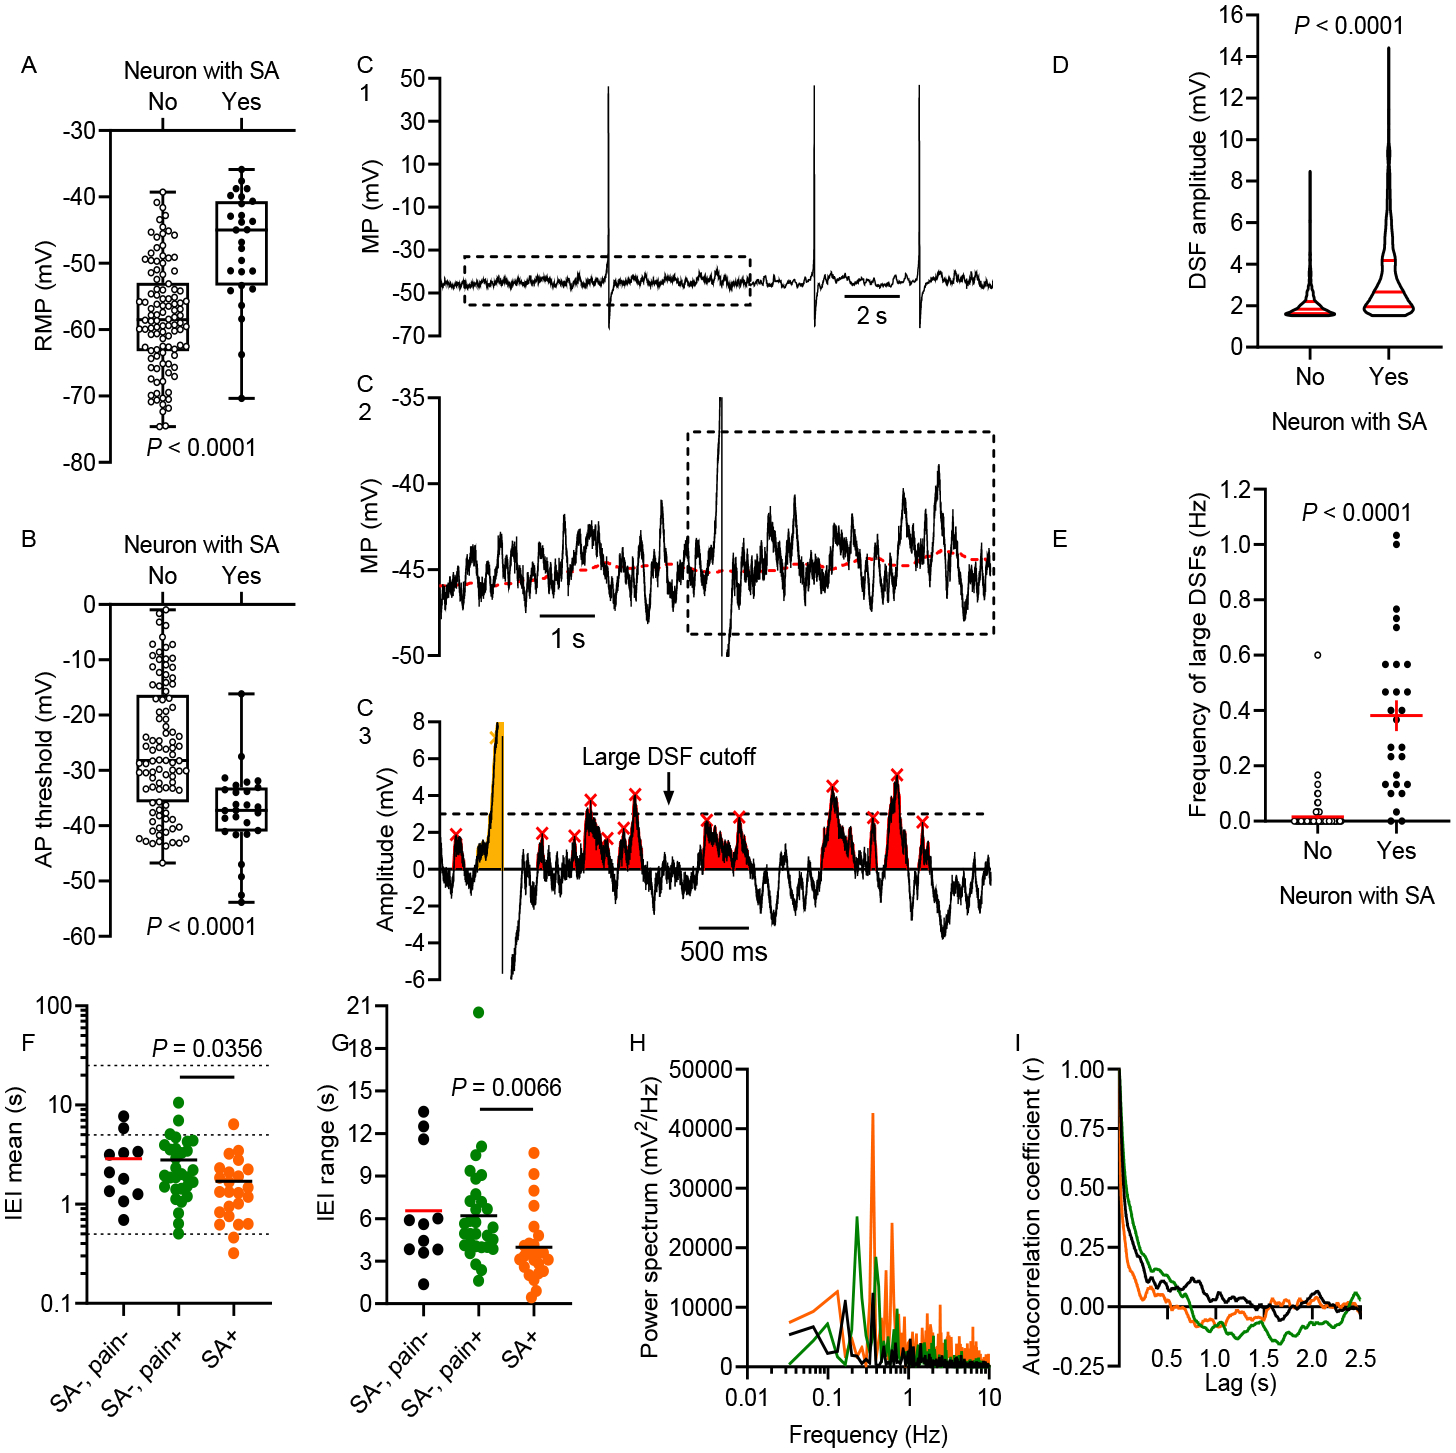
Figure 4.

SA is associated with all three of the functional electrophysiological alterations that can initiate APs. (A) RMP was depolarized in neurons with SA compared with other neurons (Mann-Whitney U test). (B) AP threshold was reduced (hyperpolarized) in neurons with SA (unpaired t test). RMP and AP threshold measurements were not corrected for the liquid junction potential, so actual values might be up to 15 mV more negative (see Methods). (C) Examples of DSFs during SA. 30-s recordings (C1) were fit using a running median (red dashed line in C2) for RMP. Residual data were used to analyze subthreshold (red) and suprathreshold (yellow) DSFs as shown in C3. Large DSFs are defined as those depolarized ≥ 3 mV relative to the median RMP. (D) Amplitudes of all DSFs ≥ 1.5 mV were larger in neurons with SA (Mann-Whitney U test). (E) The frequency of large DSFs (≥ 3.0 mV) was higher in neurons with SA (Welch’s unpaired t test). (F) Mean interevent intervals (IEIs) between DSFs ≥ 1.5 mV across neurons without SA or pain association (SA−, pain−), without SA but with associated pain (SA−, pain+), and with SA and a pain association (SA+, pain+). Horizontal lines indicate 0.5, 5, and 25 s on the y-axis. (G) Large range of IEIs within individual neurons representing each group (same group colors as in panel F). (H) Distributions of frequencies within the 30-s recordings found by Fourier analysis for each neuron in panel G, revealing low dominant frequencies. (I) Autocorrelation analysis for the neurons in panels G-H, showing little temporal correlation between the occurrence of each presumptive DSF and subsequent DSFs. No prominent peaks were found at lag times greater than those plotted.
