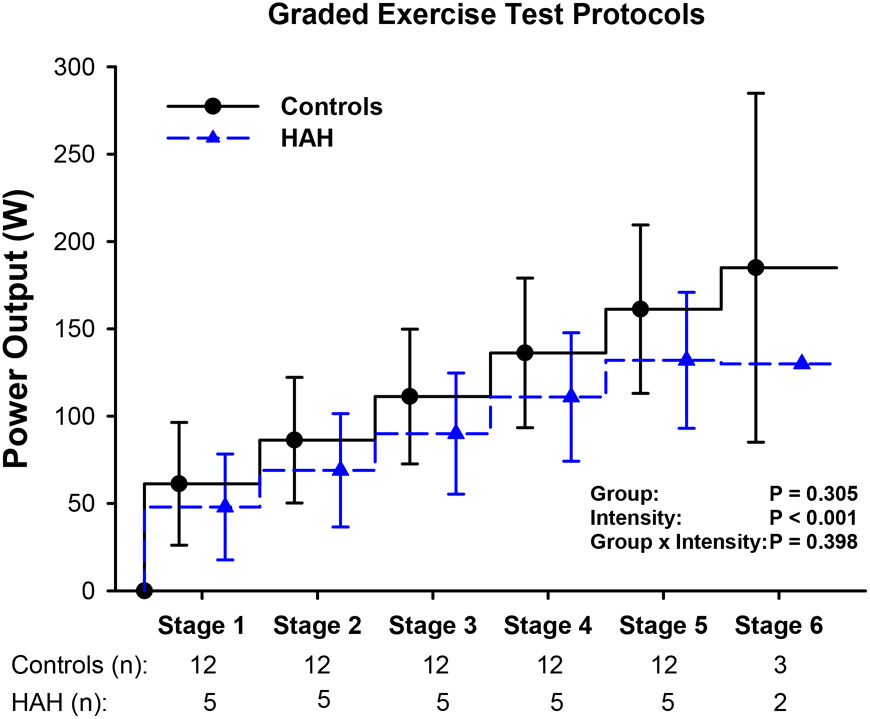
Figure 1: Power outputs achieved during graded exercise tests in humans with HAH and healthy controls.
Stepwise plots depicting the power output achieved at each stage of the graded exercise test. The number of participants reaching the stage are denoted by ‘n’ below the x-axis. Abbreviations: HAH; high affinity hemoglobin, W; watts. Data are presented as mean ± SD.

