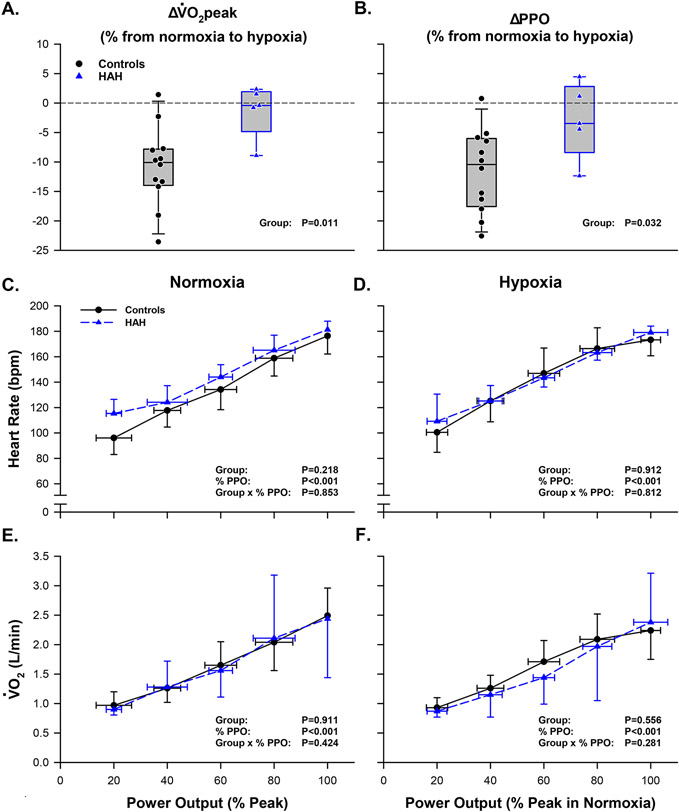
Figure 2: Normoxic and hypoxic graded exercise tests in humans with HAH and healthy controls.
(A, B) Box plots depicting the percent change in VȮ2peak and PPO from normoxia to hypoxia. (C, E) Heart rate and during the normoxic graded exercise test. (D, F) Heart rate and during the hypoxic graded exercise test. Abbreviations: HAH; high affinity hemoglobin, ; peak oxygen uptake; PPO; peak power output, ; oxygen uptake, bpm; beats per minute, L/min, liters per minute. Heart rate and data are presented as mean ± SD.

