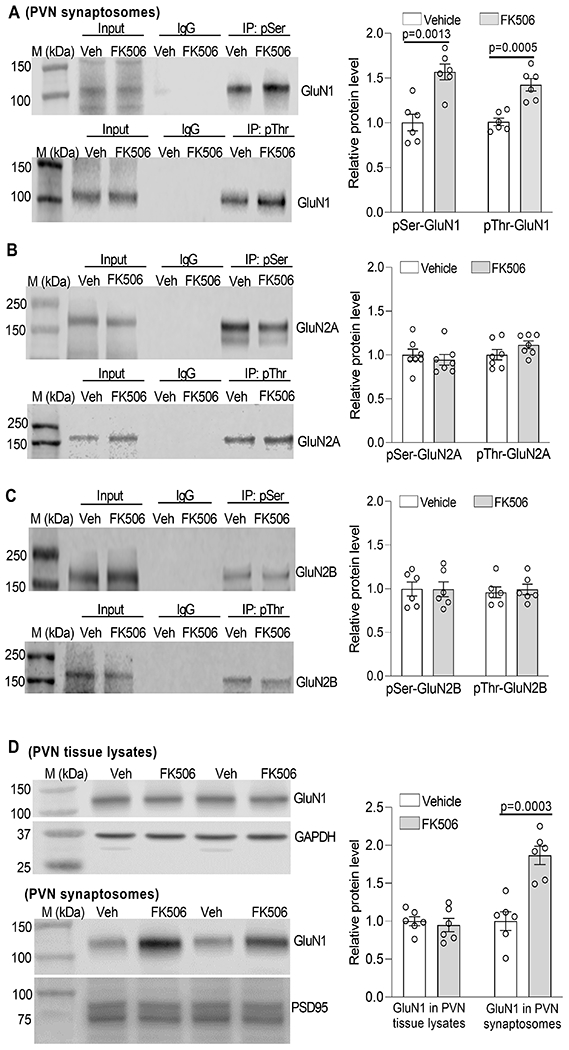
Figure 2. Repeated systemic treatment with FK506 increases NMDAR phosphorylation and synaptic trafficking in the PVN.

A-C, Representative blotting images and quantification show the protein levels of phosphoserine (pSer)/phosphothreonine (pThr)-GluN1 (A, n = 6 rats per group), pSer/pThr-GluN2A (B, n = 7 rats per group), and pSer/pThr-GluN2B (C, n = 6 rats per group) in PVN synaptosomes from rats 7 days after terminating treatment with FK506 or Veh. D, Representative blotting images and quantification show the protein levels of GluN1 in PVN tissue lysates and PVN synaptosomes from rats 7 days after stopping treatment with FK506 or Veh (n = 6 rats per group). Two-tailed Student’s t test. Data are expressed as mean ± SEM.
