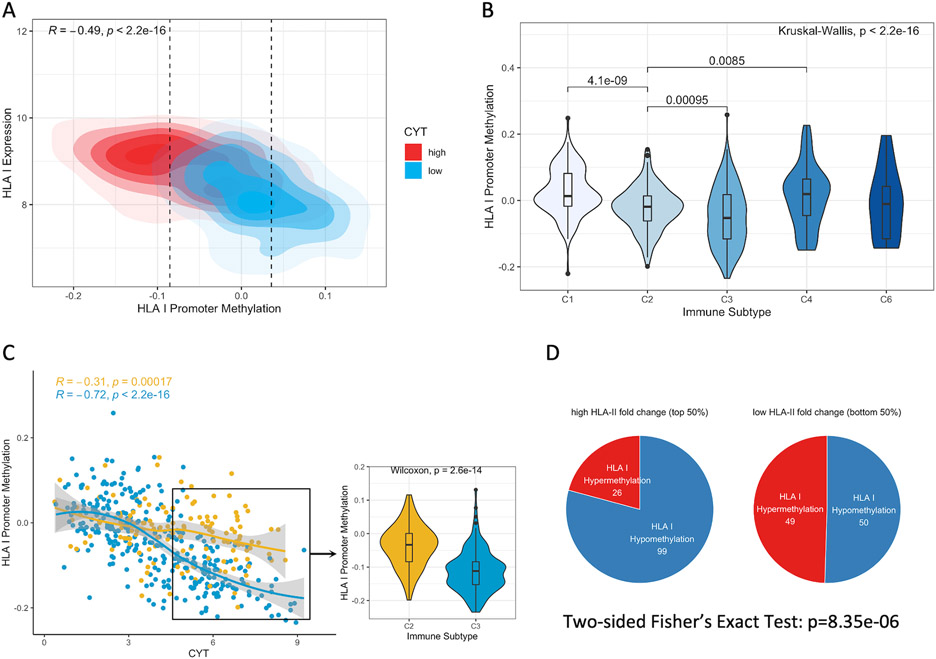
Figure 4. HLA Class I Methylation Is Favored in A Subset of Hot Tumors and Dampens Immune Activity.
(A) A kernel density plot of HLA I promoter methylation (tumor – normal) and expression across groups of high (top 50%) or low cytolytic activity (CYT). Correlation coefficient and p-values are calculated from Spearman's rank correlation. Hypomethylation: bottom 25%; Hypermethylation: top 25%. (B) HLA promoter methylation across five immune subtypes (excluding C5 with no available data). P-values between pairwise immune subtypes are calculated by Wilcoxon rank-sum test. P-value across all immune subtypes is calculated by the Kruskal-Wallis test. (C) Left panel: The Spearman correlations between CYT and HLA I promoter methylation in C2 and C3 tumors. Right panel: HLA I promoter methylation in tumors with high CYT across C2 and C3. P-value is calculated by Wilcoxon rank-sum test. (D) Association between HLA II fold change and aberrant methylation states at HLA I promoters in all samples. Numbers on pie charts indicate the number of tumor samples showing hypermethylated or hypomethylated HLA I genes. P-value is calculated from two-sided Fisher's Exact Test.

