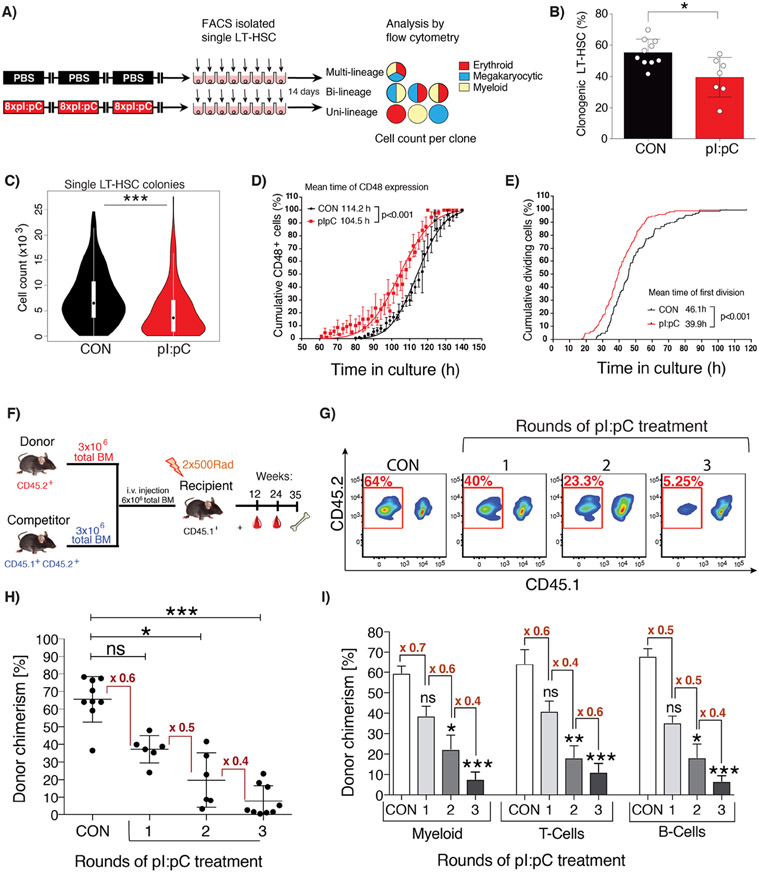
Figure 1. Repetitive exposure to inflammatory stress progressively compromises the functional potency of LT-HSCs.
(A) Schematic representation of in vitro single cell liquid culture assay using purified LT-HSCs. (B) The percentage of LT-HSC clones capable of forming colonies is shown for LT-HSC isolated from CON or Tx3X mice (plus mean±SD, n=7-10 mice). (C) Violin plots representing the total number of daughter cells generated by each LT-HSC. (D&E) In vitro time-lapse microscopy-based cell tracking, evaluating: (D) the cumulative percentage of cells expressing CD48 versus time in culture, fitted to a Gaussian distribution curve; (E) the cumulative incidence of LT-HSC having undergone first cell division per unit time in culture (mean±SD, n= 128 or 148 individual LT-HSCs for CON or pI:pC groups, respectively; n=3 independent biological repeats per group). (F-I) Competitive repopulation assays were performed as described in methods. PB was analyzed at 24 weeks post-transplantation. (F) Schematic representation of the standard competitive transplantation assay (G) Representative flow cytometry plots of total donor leukocyte chimerism in PB. PB cells derived from donor BM isolated from pI:pC-treated or CON donors are outlined in red. (H) Percentage total donor leukocyte chimerism in PB for the indicated groups. Each dot represents transplantation outcome of BM from an individual treated donor mouse (I) Percentage donor chimerism in defined compartments of PB. Myeloid=CD11b+, T-cells=CD4+/CD8+, B-cells=B220+ (plus mean±SD, n=8-9 mice per group). ns=P>0.05, *P<0.05, **P<0.01,***P<0.001.

