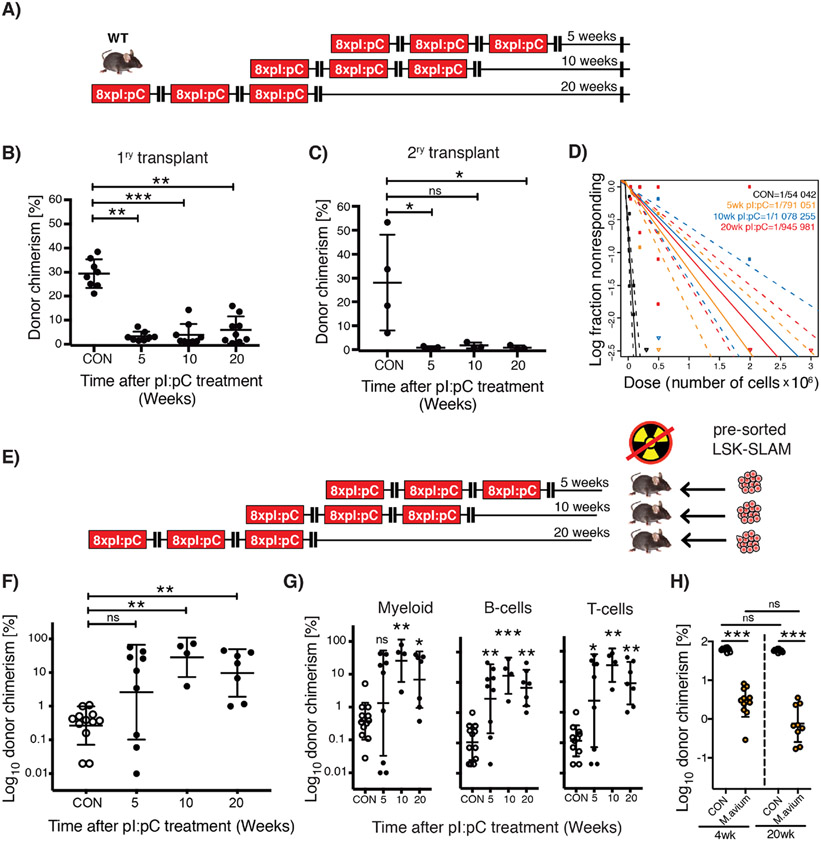
Figure 2. Lack of HSC functional recovery in vivo following inflammatory stress.
(A) Schematic representation of treatment schedule incorporating increasing duration of recovery post-challenge with pI:pC. (B&C) Serial competitive repopulation assay using BM harvested from mice at indicated time points post-treatment: (B) Percentage total donor leukocyte chimerism at 24 weeks post-transplantation in primary recipients; (C) Percentage total donor leukocyte chimerism at 24 weeks post-transplantation in secondary recipients. Each dot represents transplantation outcome of BM from an individual treated mouse or primary recipient mouse (plus mean±SD). (D) Limiting dilution transplantation assays to determine LT-HSC frequency in BM isolated from femora of individual mice. 95% confidence intervals are indicated with dashed lines (n=6-9 recipients per dilution, per donor, representing analysis of BM from 3-4 individual treated donor mice). (E) Schematic representation of reverse transplant experiment. Mice exposed to the indicated treatment regimen were injected i.v. with saturating doses of purified donor HSCs in the absence of any conditioning with irradiation. (F&G) Percentage donor contribution in PB at 24 weeks post-reverse transplantation to the following defined populations: (F) total leukocytes; (G) Myeloid (CD11b+/GR-1+), B-cells (B220+) and T-cells (CD4+/CD8+). Each dot indicates an individual treated recipient (plus mean ± SD). (H) Competitive repopulation assay using BM from mice infected three times with M. avium, treated with clarithromycin to resolve the infection, then harvested at either 4- or 20-weeks post-treatment. Percentage total donor leukocyte chimerism at 24 weeks post-transplantation is shown. Control (CON) group was also treated with clarithromycin for equivalent time period. Each circle indicates a transplantation outcome from an individual treated donor mouse. ns=P>0.05, *P<0.05, **P<0.01, ***P<0.001.

