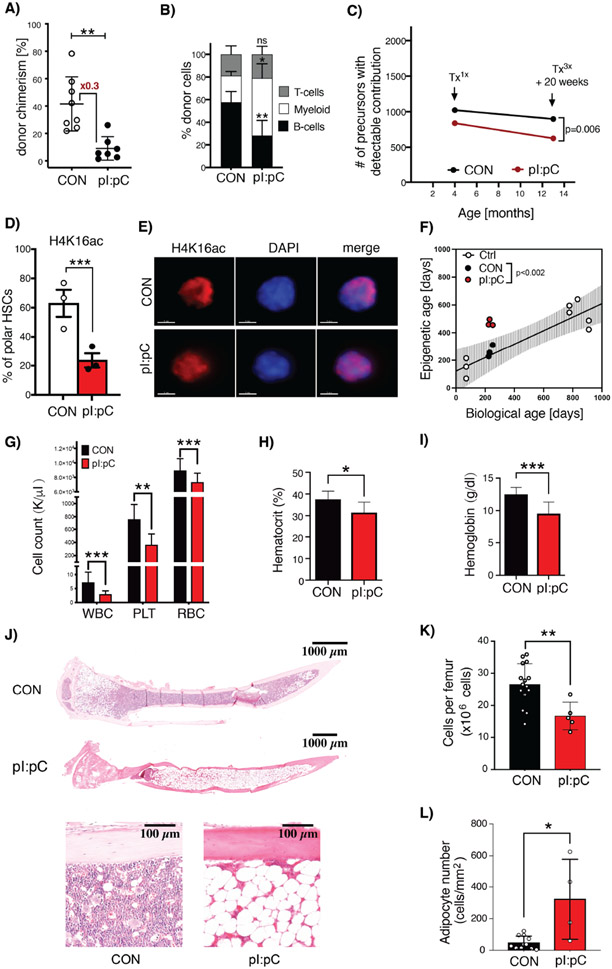
Figure 3. Inflammatory challenge promotes accelerated hematologic aging.
(A&B) PB flow cytometry analysis at 24 weeks post-competitive transplantation of BM cells harvested from CON or Tx3X mice at 12 months post-challenge. (A) Total donor leukocyte chimerism and (B) relative frequency of myeloid (CD11b+/Gr-1+), B- (B220+) and T-cells (CD4+/CD8+) are shown. Dots represent individual mice, mean±SD is indicated, n=7-8 mice per group. (C) The clonal complexity of LT-HSC in CON, Tx1x or Tx3X (20 weeks post-treatment) Conf-Flk-1Cre mice was calculated as previously described(Ganuza et al., 2019). n=6-10 mice per group. (D&E) Assessment of polarity of distribution of H4K16ac within the nucleus of LT-HSCs. (D) Percentage of LT-HSCs isolated from CON or Tx3X mice that had a polar distribution of H4K16ac staining. n=3 mice per group; 39 single cells for CON and 41 single cells for Tx3X mice. Each point indicates an individual mouse; data are mean±SD. (E) Representative single-cell IF images showing the distribution of H4K16ac (red) in the nuclei of LT-HSCs from Tx3X or CON mice. Nuclei are stained with DAPI (blue), scale bar=3μm. (F) Plot of chronological age versus biological age calculated via DNA methylome clock, for LT-HSCs isolated from: non-treated young and aged mice (white circles); Tx3X mice (red circles); and age-matched CON mice (black circles). Line represents linear regression on young and aged non-treated mice with 95% CI (shaded area). (G-L) Mice were challenged repeatedly with pI:pC or PBS in early/mid-life as illustrated in Figure S4A. At 24 months of age, the following hematologic parameters were assessed: (G) Leukocyte (WBC), platelet (PLT) and red blood cell (RBC) counts in PB; (H) PB hematocrit; (I) Hemoglobin; (J) Representative whole mount H&E sections of tibiae; (K) BM cellularity per femur; and (L) Microscopy-based enumeration of adipocyte density within medullary cavity of tibiae (n=5-15 mice per group in G-I). Circles represent individual treated aged mice (plus mean±SD). *P<0.05, **P<0.01, ***P<0.001.

