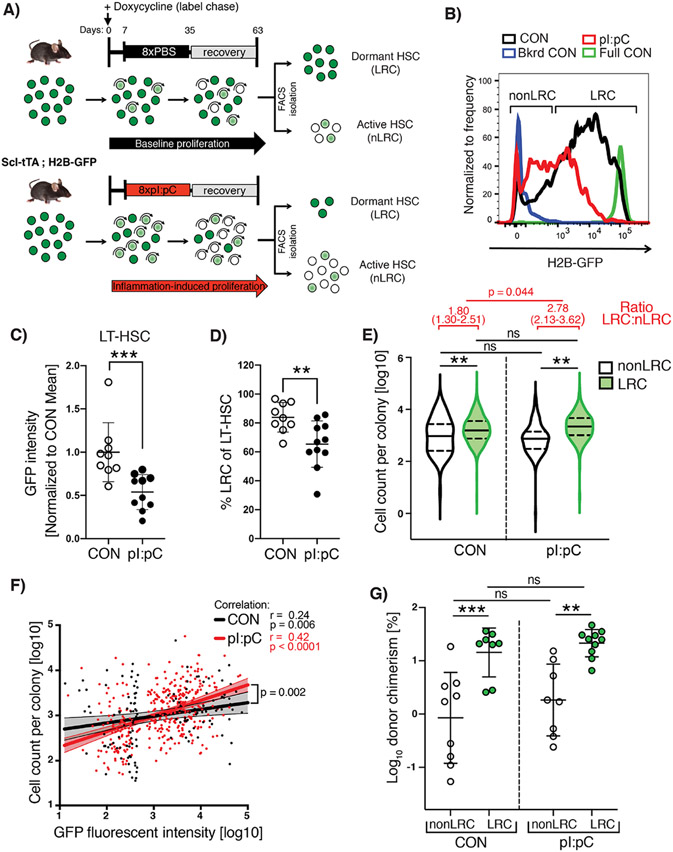
Figure 4. Dormant HSCs are protected from inflammation-associated functional decline while proliferating cells fail to self-renew.
(A) Schematic representation of combined label retention and treatment schedule. Scl-tTA;H2B-GFP mice were treated with pI:pC or PBS (CON) as indicated. Label chase was induced by sustained administration of doxycycline starting 7 days before pI:pC/PBS treatment. Flow cytometry analysis/sorting was performed on BM at 8 weeks after initiation of pI:pC/PBS treatment. (B) Representative flow cytometry histograms of GFP fluorescence in LT-HSCs from PBS and pI:pC treated mice. Background fluorescence (Bkrd CON) and fully labeled (Full CON) controls are indicated (C) Mean fluorescent intensity of GFP in LT-HSCs and (D) the proportion of LRCs within the LT-HSC population in CON and pI:pC treated mice. Each dot represents a single mouse (plus mean±SD). (E) Violin plots showing the cell number of progeny generated per individual LRC or nonLRC following 14 days in-vitro culture (n=4-5 mice per group, n=280, 364, 293 or 260 analyzed clones for nonLRC CON, LRC CON, nonLRC pI:pC and LRC pI:pC, respectively). Solid lines represent median, dashed lines interquartile range. Analysis of ratio between LRC and nLRC groups is shown in red. (F) Correlation analysis between GFP intensity and cell number of progeny per individual LT-HSCs following 14 days in-vitro culture (n=3 mice per group, n=132 and n=363 analyzed LT-HSCs per CON and pI:pC group respectively). Dots represent individual LT-HSCs, lines are simple linear regression with 95% CI. (G) Percentage total donor PB leukocyte chimerism following competitive transplantation of LRC or nonLRC from CON or pI:pC-treated mice at 12 weeks post-transplantation. n=8-10 donor mice per condition. ns=P>0.05, *P<0.05, **P<0.01, ***P<0.001).

