
Figure 1.
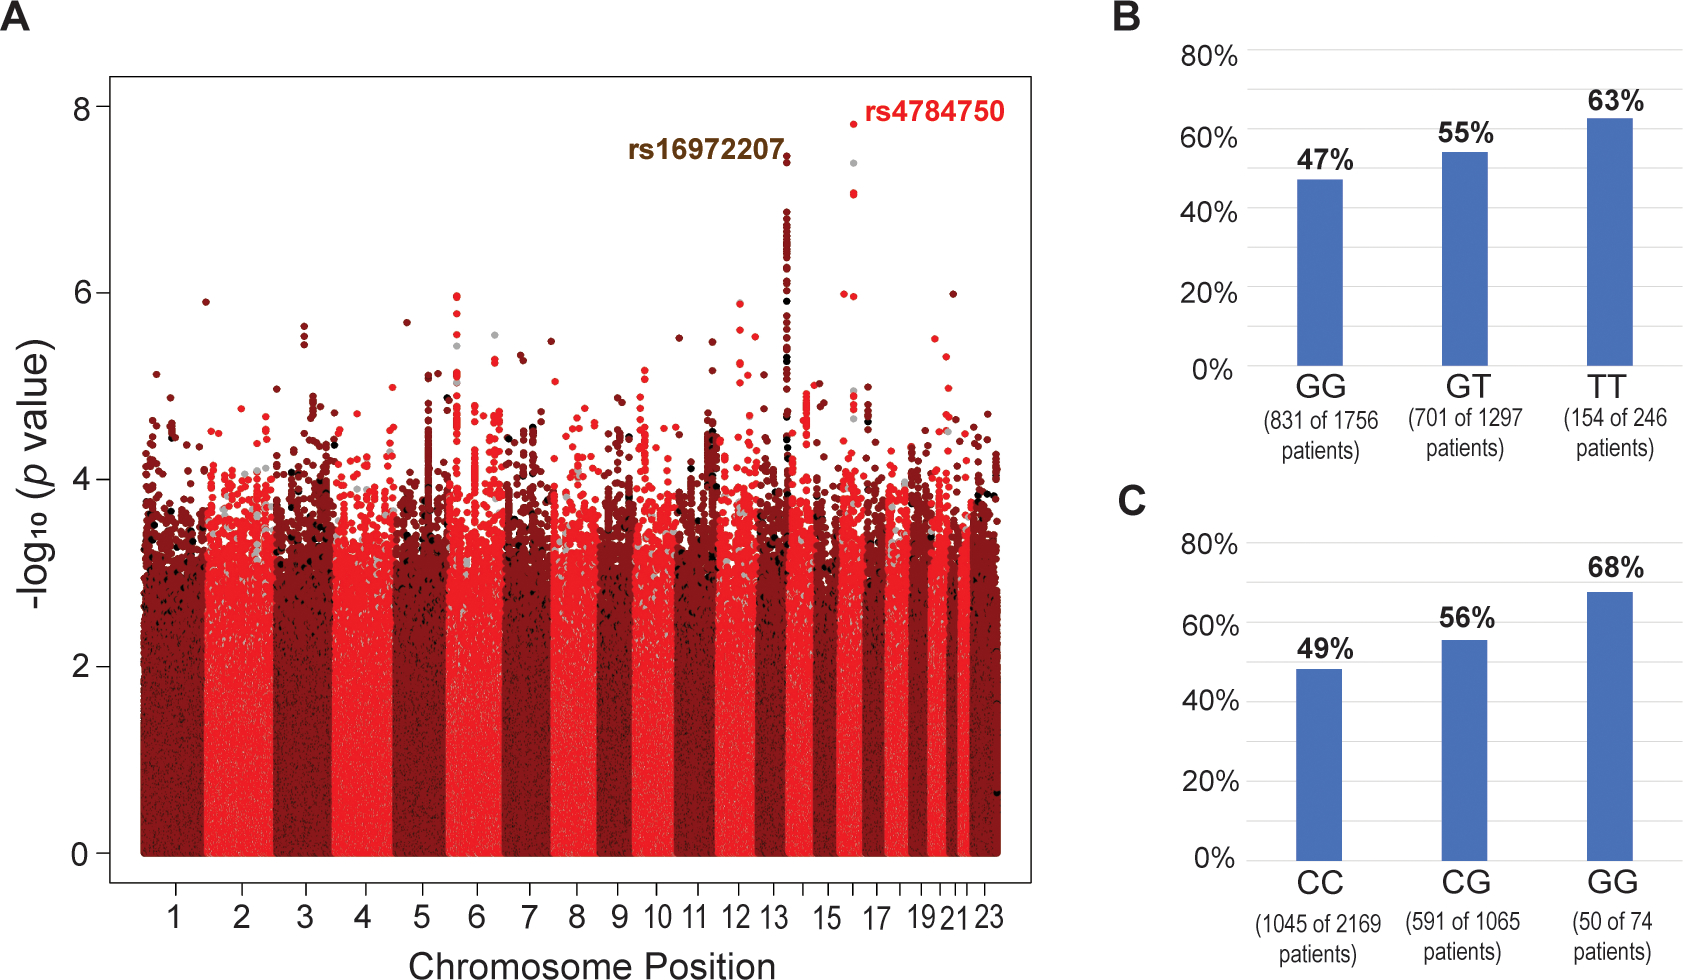
(A) Manhattan plot for the association between neutropenic or leukopenic events (NLEs) and the genotypes from genome-wide genotyping for SNPs with a minor allele frequency > 0.01 (imputed: red/dark red; genotyped: black/grey). (B and C) Distribution of genotypes and neutropenic and leukopenic events (NLEs) among all genotyped patients for the top SNPs in the 16q13 (rs4784751; P = 1.56E-8) locus (B) and 13q33.3 (rs16972207; P = 3.42E-8) locus (C).