
Figure 5.
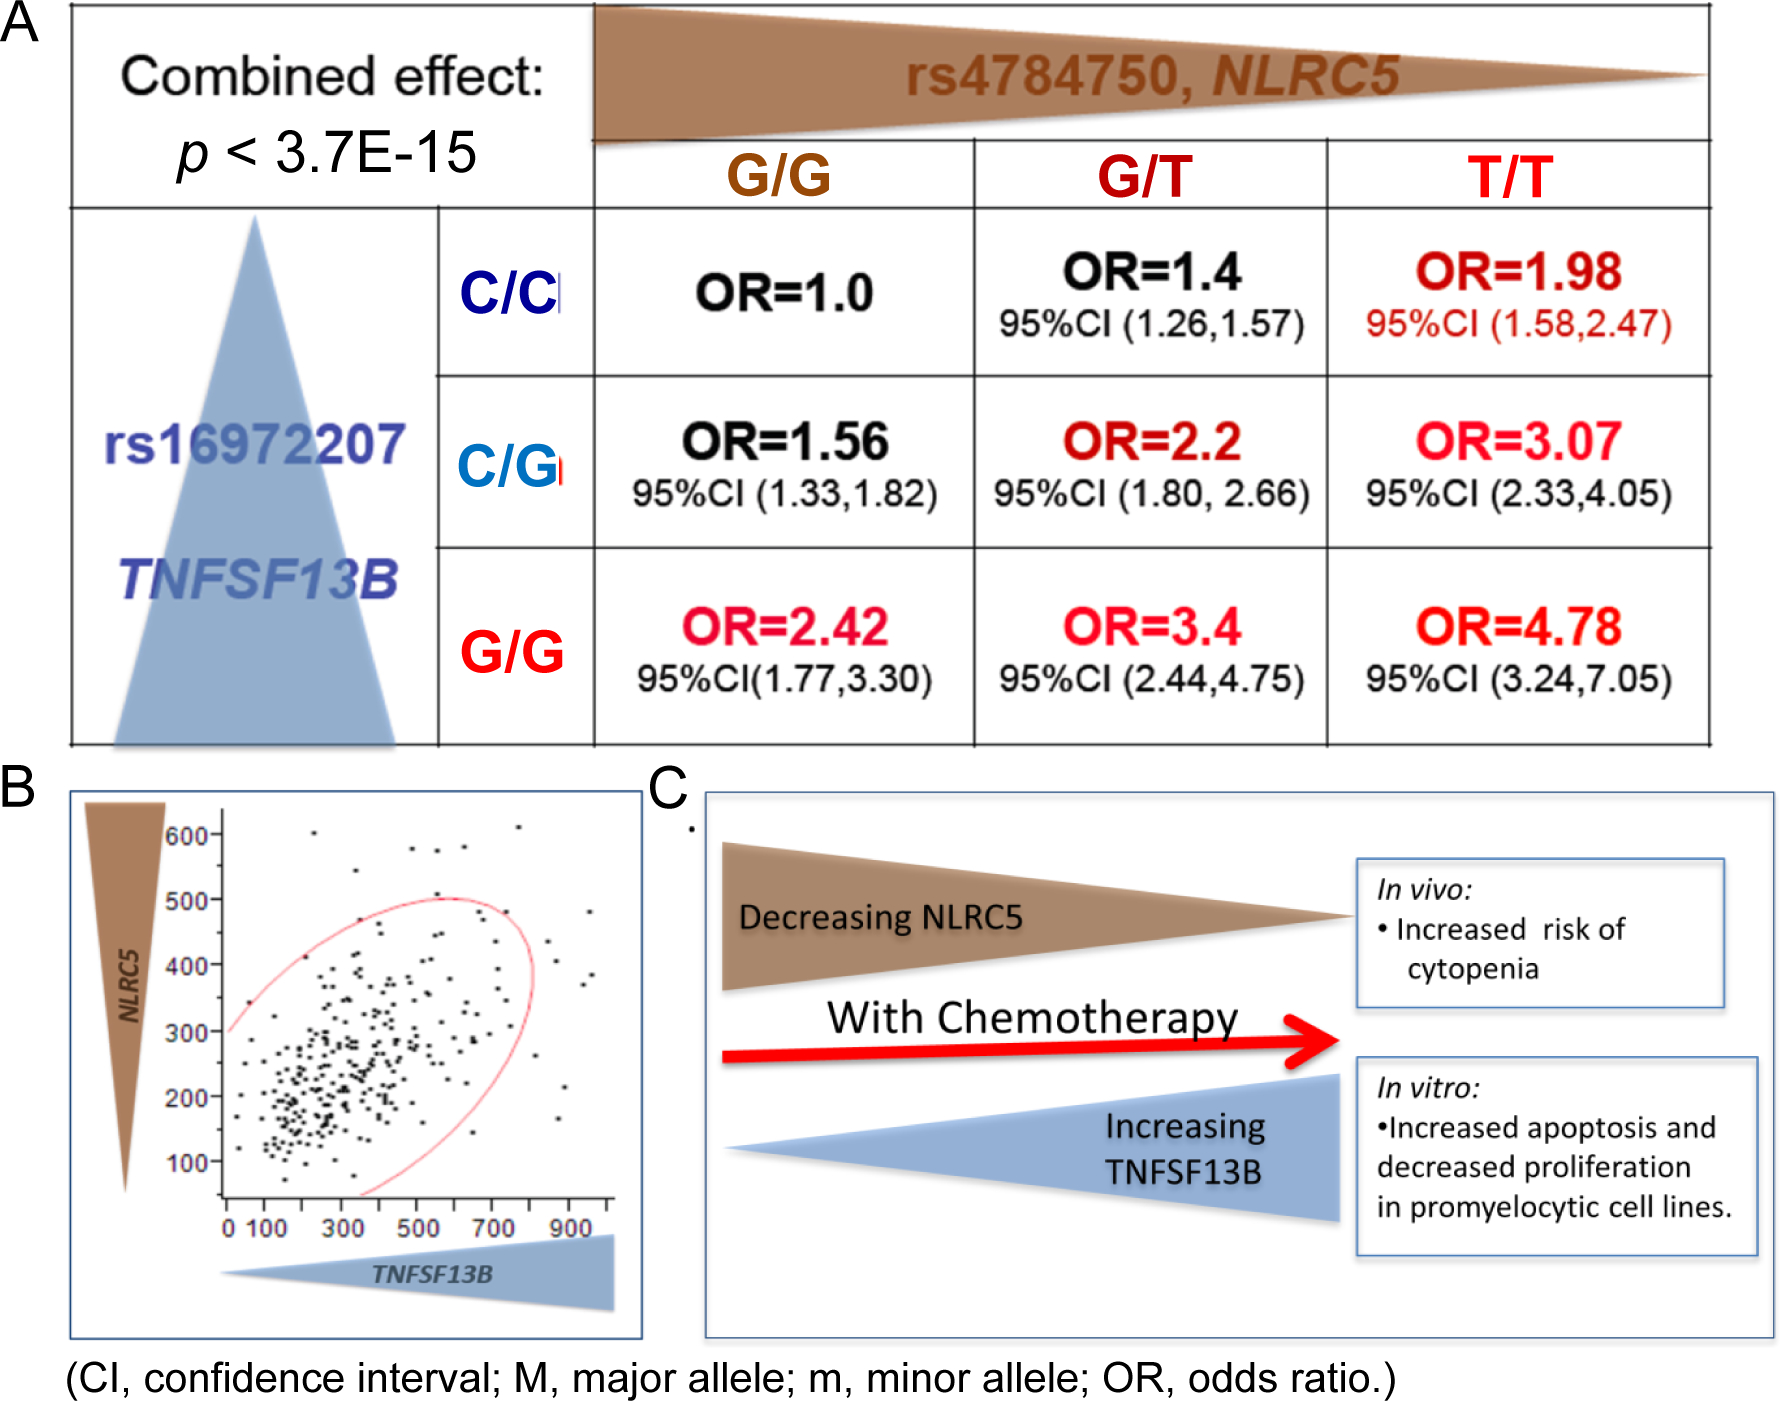
(A) Combined effect of NLRC5 and TNFSF13B top SNPs calculated as the odds ratio for developing cytopenia/toxicity with chemotherapy. (B) Correlation of the gene expression between NLRC5 and TNFSF13B in the Mayo Human Variation Panel of lymphoblastoid cell lines (LCLs) derived from 287 individuals. (C) Putative model of the interaction of NLRC5 and TNFSF13B and their influence on the risk concerning cytopenia.