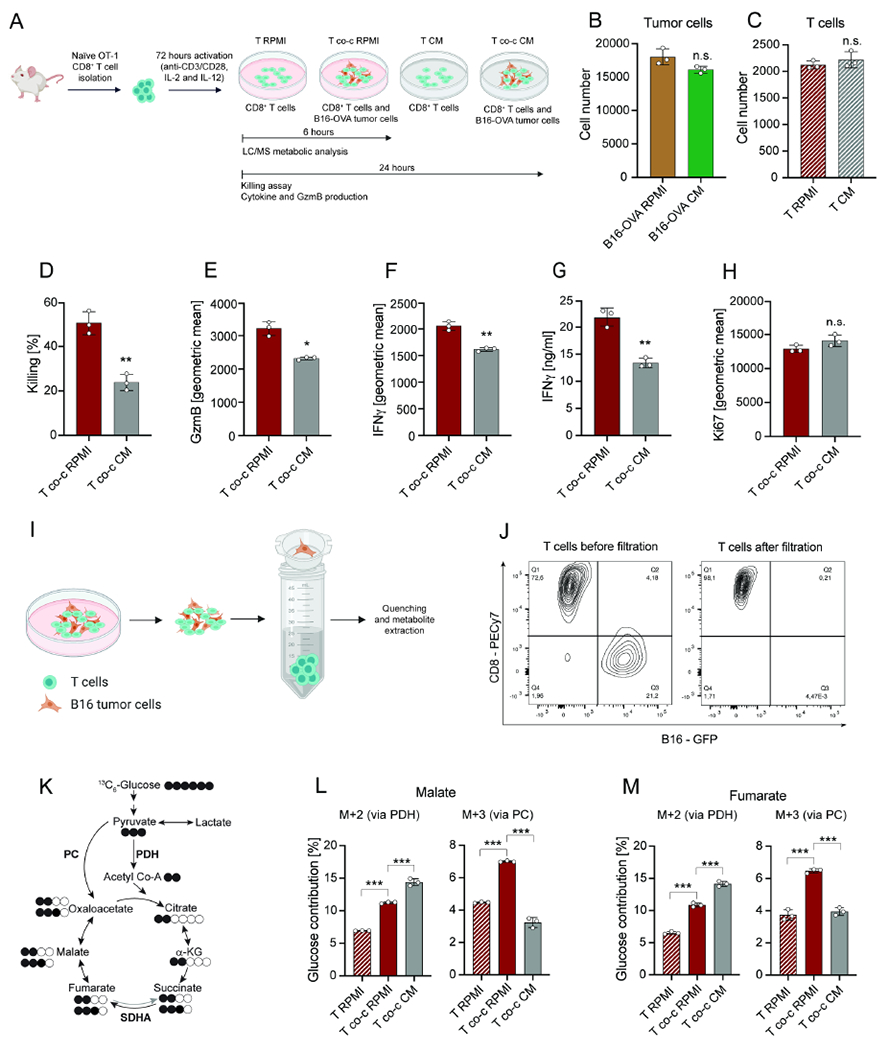
Figure 1. TME mimicking nutrient availability impairs CD8+ T cell cytotoxicity and PC activity.

(A) Schematic representation of CD8+ T cell activation and co-culture with tumor cells in RPMI and CM. T indicates T cells in mono-culture and T co-c indicates T cells in co-culture with tumor cells. (B) Cell number of B16-OVA tumor cells in RPMI and CM. Analysis was performed after 24 hours. (C) Cell number of CD8+ T cells in mono-culture in RPMI and CM. Analysis was performed after 24 hours. (D-F) Killing and geometric mean of GzmB and IFNγ expression by CD8+ T cells in co-culture with B16-OVA tumor cells in RPMI and CM. Analysis was performed after 24 hours. (G) Secreted IFNγ levels by CD8+ T cells in co-culture with B16-OVA tumor cells in RPMI and CM. Analysis was performed after 24 hours. (H) Geometric mean of Ki67 expression by CD8+ T cells in co-culture with B16-OVA tumor cells in RPMI and CM. Analysis was performed after 24 hours. (I) Schematic representation of cell-size-based separation of B16 tumor cells and CD8+ T cells. (J) Flow cytometric measurement of T cell populations before and after filtration. (K) Schematic representation of 13C6-glucose contribution to TCA cycle intermediates via PDH or PC activity. Grey arrow depicts low activity. White circles indicate carbon-12 (12C) while black circles indicate 13C atoms from glucose. (L-M) Contribution of 13C6-glucose to malate and fumarate M+2 (derived from PDH activity) and M+3 (derived from PC activity) in CD8+ T cells in mono-culture and in co-culture with B16-OVA tumor cells in RPMI and CM. Analysis was performed after 6 hours. The number of biological replicates for each experiment was n=3. Error bars represent s.d. Two-tailed unpaired Student’s T-test was performed. *P<0.05; **P<0.01; ***P<0.001. See also Figure S1.
