
Figure 2. Lactate secretion by tumor cells rewires CD8+ T cell metabolism.
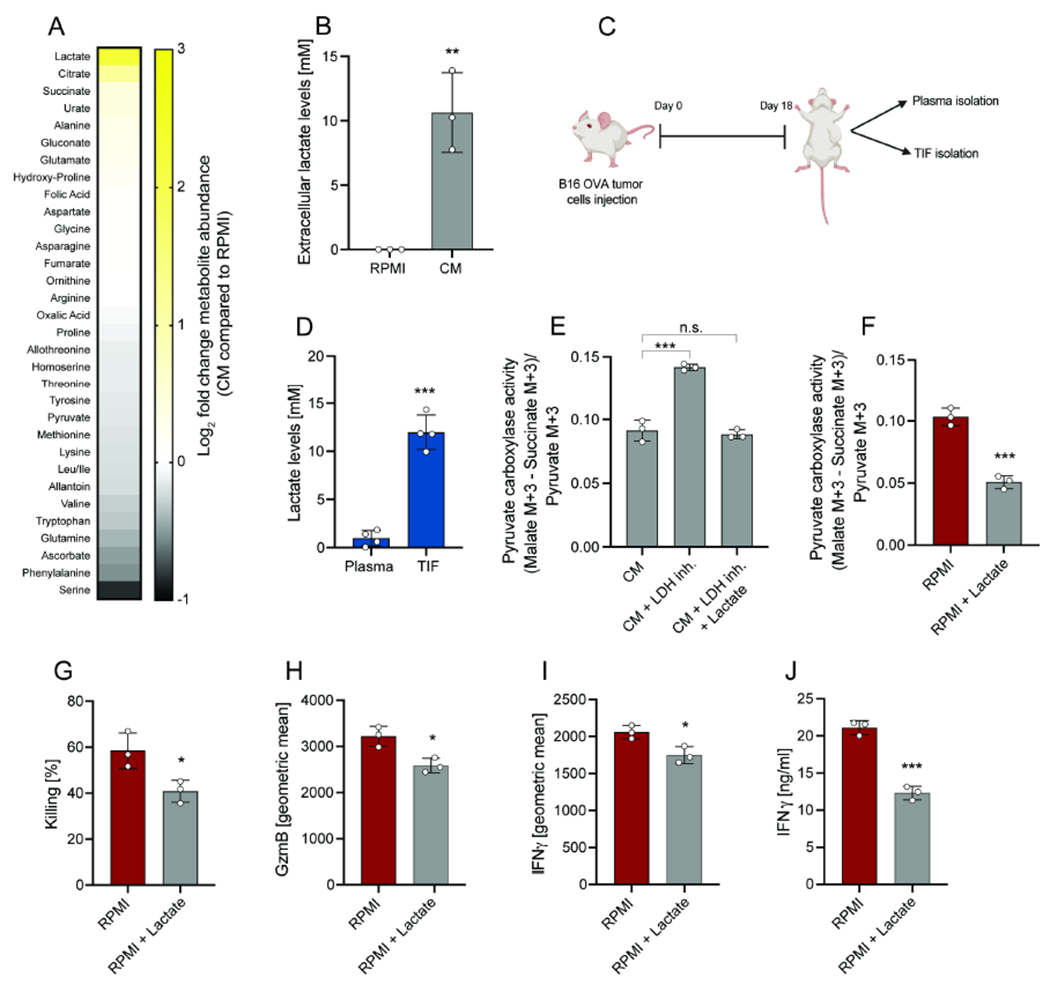
(A) Heatmap representing metabolite changes in tumor CM compared to RPMI. CM was obtained after 24 hours culture of tumor cells. (B) Absolute extracellular lactate levels in RPMI and CM. CM was obtained after 24 hours culture of tumor cells. (C) Schematic representation of plasma and TIF isolation from mice bearing B16-OVA tumors. Analysis was performed at day 18 after tumor implantation. (D) Absolute lactate levels in TIF of mice with B16-OVA tumors. (E) PC activity of CD8+ T cell in co-culture with B16-OVA tumor cells in CM, in CM obtained from tumor cells cultured with LDH inhibitor or in CM obtained from tumor cells cultured with LDH inhibitor + supplementation of lactate. Analysis was performed after 6 hours. (F) PC activity of CD8+ T cell in co-culture with B16-OVA tumor cells in RPMI and RPMI + lactate (10mM). Analysis was performed after 6 hours. (G-I) Killing and and geometric mean of GzmB and IFNγ expression by CD8+ T cells in co-culture with B16-OVA tumor cells in RPMI or RPMI + lactate (10mM). Analysis was performed after 24 hours. (J) Secreted IFNγ levels by CD8+ T cells in co-culture with B16-OVA tumor cells in RPMI or RPMI + lactate (10mM). Analysis was performed after 24 hours. The number of biological replicates for each experiment was n≥3. Error bars represent s.d. Two-tailed unpaired Student’s T-test was performed. *P<0.05; **P<0.01; ***P<0.001. See also Figure S2.