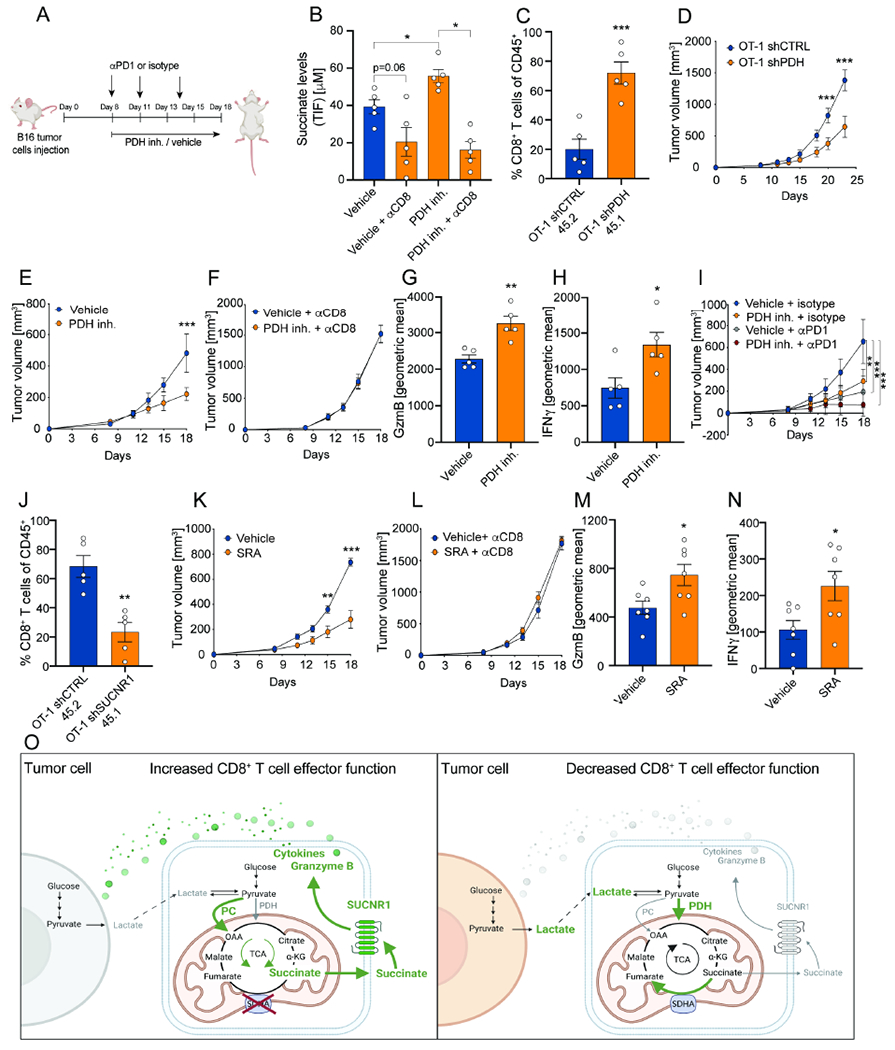
Figure 6. Inhibition of PDH in vivo increases succinate levels in the TME and promotes anti-tumor immunity.

(A) Schematic representation of treatment with the PDH inhibitor CPI-613 (25mg/kg) or vehicle +/− combination with isotype control or αPD-1 in mice with B16 OVA tumors. Isotype and αPD-1 were used at 100μg dose (three doses in total). (B) Absolute succinate levels in tumor interstitial fluid from mice treated with either vehicle or the PDH inhibitor CPI-613 with or without antibodies to specifically deplete CD8+ T cells. Analysis was performed at day 18. n=5. Two-tailed unpaired Student’s T-test was performed. (C) % of OT-1 CD8+ T cells of CD45+ with the congenic markers 45.1 and 45.2 transduced with a shRNA for PDH and CTRL in B16-OVA tumors. OT-1 shPDH 45.1 and OT-1 shCTRL 45.2 were adoptively transferred using a ratio 1:1, one day prior B16-OVA tumor implantation. Analysis was performed at day 16. n=5. Two-tailed unpaired Student’s T-test was performed. (D) Average tumor growth curves showing tumor volume in mice upon adoptive transfer of OT-1 CD8+ T cells transduced with a shRNA for PDH or CTRL. Adoptive transfer was performed 9 days after tumor implantation. n=8. A two-way Anova with Sidak’s multiple comparison test was performed. (E) Average tumor growth curves showing tumor volume in mice treated with either vehicle or the PDH inhibitor CPI-613. Vehicle: n=7; PDH inh.: n=7. A two-way Anova with Sidak’s multiple comparison test was performed. (F) Average tumor growth curves showing tumor volume in mice treated with either vehicle or the PDH inhibitor CPI-613 with antibodies to specifically deplete CD8+ T cells. Vehicle αCD8: n=9; PDH inh.: n=9. A two-way Anova with Sidak’s multiple comparison test was performed. (G-H) Geometric mean of GzmB and IFNγ expression by CD8+ T cells of tumors in mice treated with either vehicle or the PDH inhibitor CPI-613. Analysis was performed at day 15. n=10. Two-tailed unpaired Student’s T-test was performed. (I) Average tumor growth curves showing tumor volume in mice treated with either vehicle or the PDH inhibitor CPI-613 and isotype control or αPD-1. Vehicle + isotype: n=9; PDH inh. + isotype: n=8; Vehicle + αPD1 : n=8; PDH inh. + αPD1: n=9. A two-way Anova with Sidak’s multiple comparison test was performed. (J) % of OT-1 CD8+ T cells of CD45+ with the congenic markers 45.1 and 45.2 transduced with a shRNA for SUCNR1 and CTRL in B16-OVA tumors. OT-1 shSUCNR1 45.1 and OT-1 shCTRL 45.2 were adoptively transferred using a ratio 1:1, one day prior B16-OVA tumor implantation. Analysis was performed at day 16. n=5. Two-tailed unpaired Student’s T-test was performed. (K) Average tumor growth curves showing tumor volume in mice treated with either vehicle or the SRA cis-epoxysuccinic acid. Vehicle: n=5; SRA: n=5. A two-way Anova with Sidak’s multiple comparison test was performed. This is a representative experiment of two independent experiments. (L) Average tumor growth curves showing tumor volume in mice treated with either vehicle or the SRA cis-epoxysuccinic acid with antibodies to specifically deplete CD8+ T cells. Vehicle αCD8: n=5; PDH inh.: n=5. A two-way Anova with Sidak’s multiple comparison test was performed. This is a representative experiment of two independent experiments. (M-N) Geometric mean of GzmB and IFNγ expression by CD8+ T cells of tumors in mice treated with either vehicle or the SRA cis-epoxysuccinic acid. Analysis was performed at day 15. n=7. Two-tailed unpaired Student’s T-test was performed. (O) Schematic representation CD8+ T cell-tumor cell metabolic circuit. On the left the metabolic activity of a metabolically fit CD8+ T cell is depicted. On the right, tumor cell metabolism impairs CD8+ T cell activity causing decreased CD8+ T cell effector function. Overall, the figure shows extracellular lactate to modulate TCA cycle entry of pyruvate through either PC or PDH, and to dictate the capacity of T cells to secrete succinate to promote cytolytic activity through the SUCNR1. Green indicates up-regulation. Grey and red indicate down-regulation. Error bars represent s.e.m. *P<0.05; **P<0.01; ***P<0.001. See also Figure S6.
