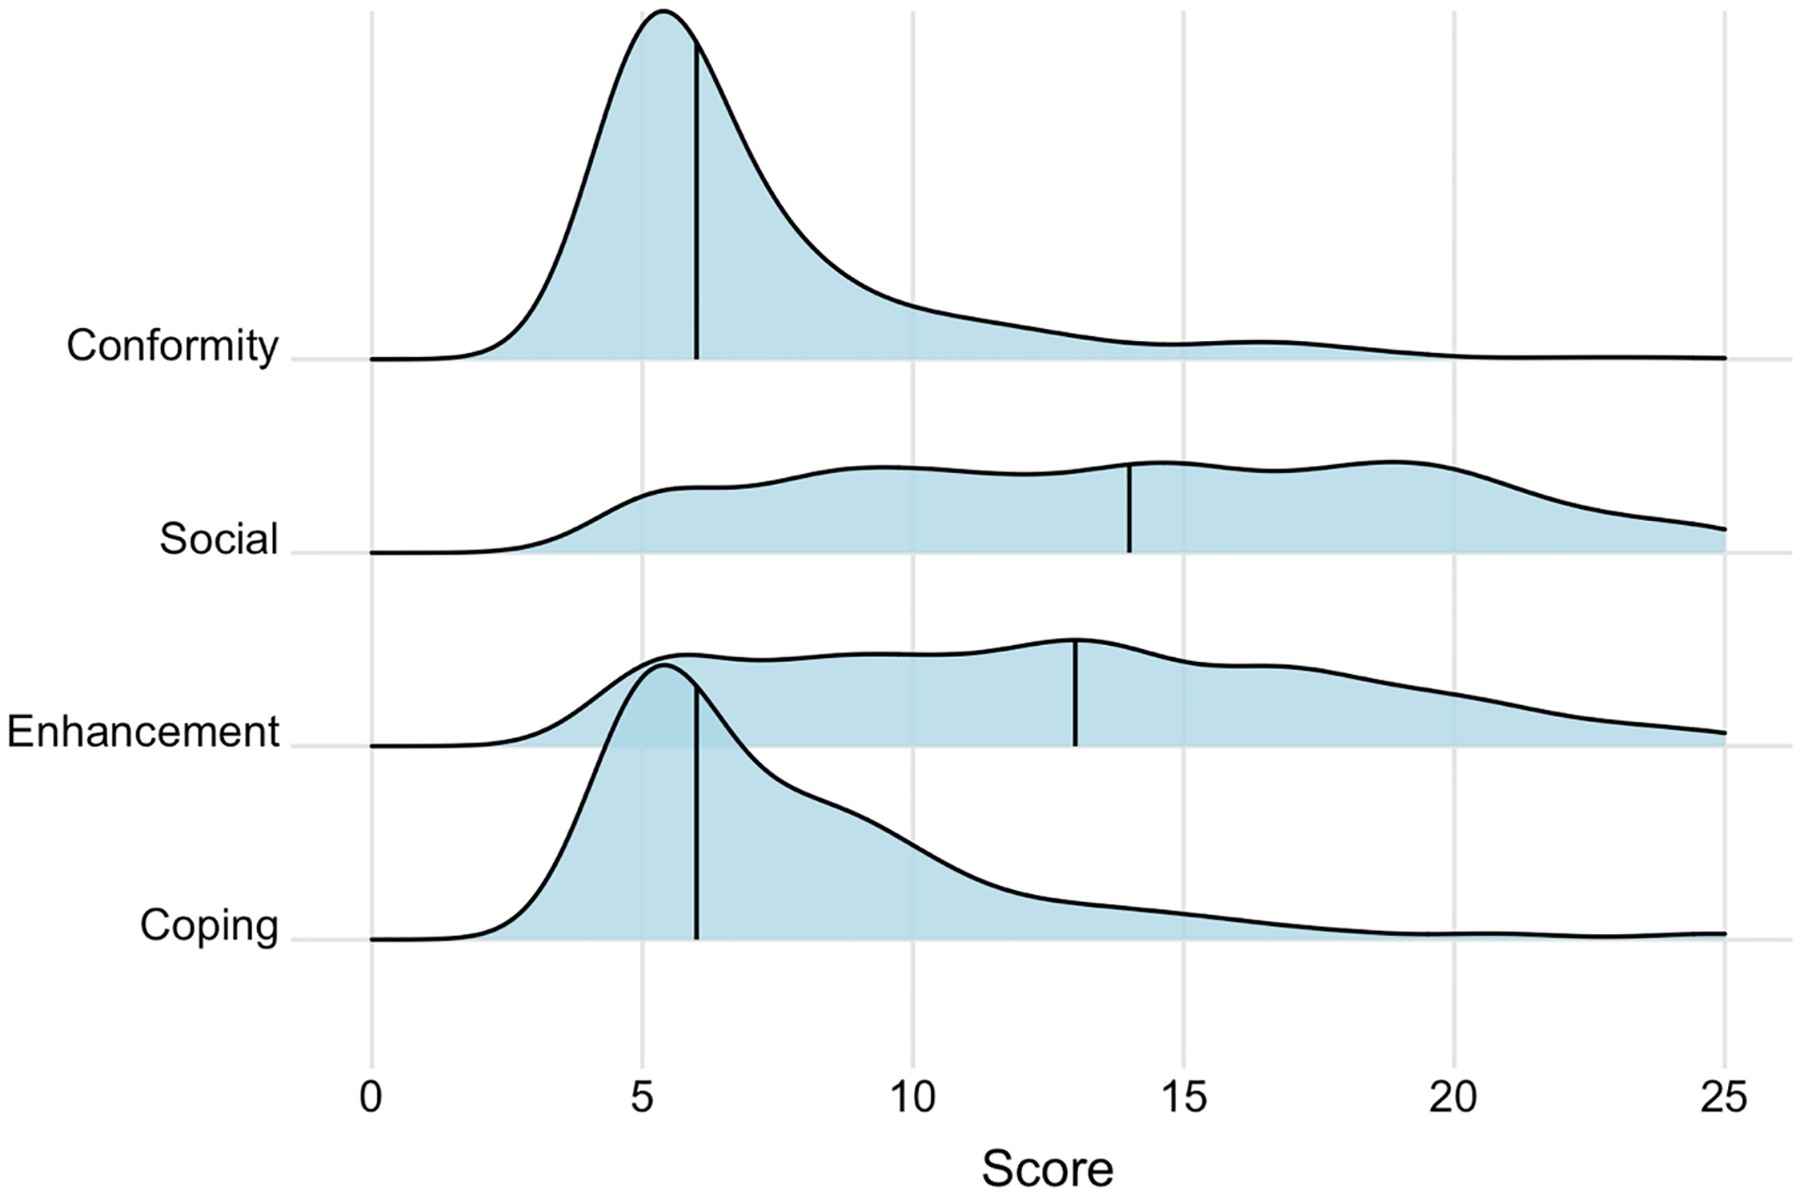
Fig. 2.

Density plots of Drinking Motives Questionnaire scores among students who drank at baseline and were randomized to an API (n=357)
Note: Vertical lines are drawn at the median (conformity: 6, social: 14, enhancement: 13, and coping: 6).

Density plots of Drinking Motives Questionnaire scores among students who drank at baseline and were randomized to an API (n=357)
Note: Vertical lines are drawn at the median (conformity: 6, social: 14, enhancement: 13, and coping: 6).