. 2022 Apr 20;28(15):3356–3366. doi: 10.1158/1078-0432.CCR-21-2834

Figure 4.

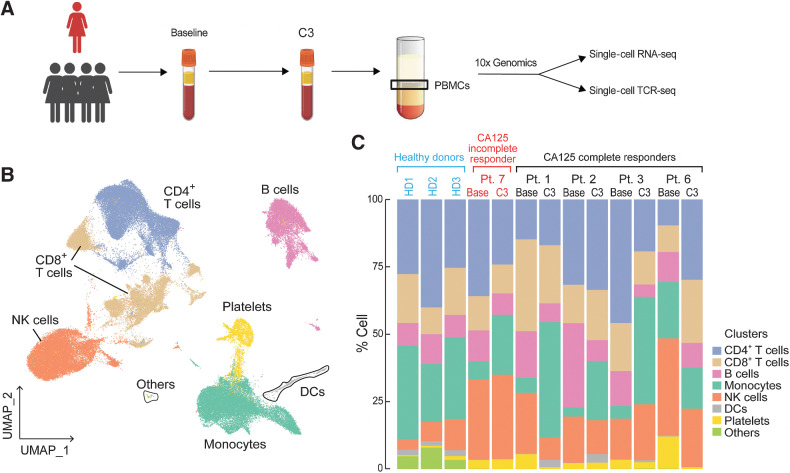
Figure 4. Dynamics of peripheral blood immune cell populations following chemotherapy. A, A summary of sample collection and single-cell analysis. B and C, UMAP (B) and the relative percentage (C) of immune cell populations in the integrated PBMC samples from patients 1, 2, 3, 6, and 7. No statistically significant changes were detected between pre-chemotherapy (Base) and the third cycle of chemotherapy (C3) in each immune cell population using a two-sided one-sample t test.

Dynamics of peripheral blood immune cell populations following chemotherapy. A, A summary of sample collection and single-cell analysis. B and C, UMAP (B) and the relative percentage (C) of immune cell populations in the integrated PBMC samples from patients 1, 2, 3, 6, and 7. No statistically significant changes were detected between pre-chemotherapy (Base) and the third cycle of chemotherapy (C3) in each immune cell population using a two-sided one-sample t test.