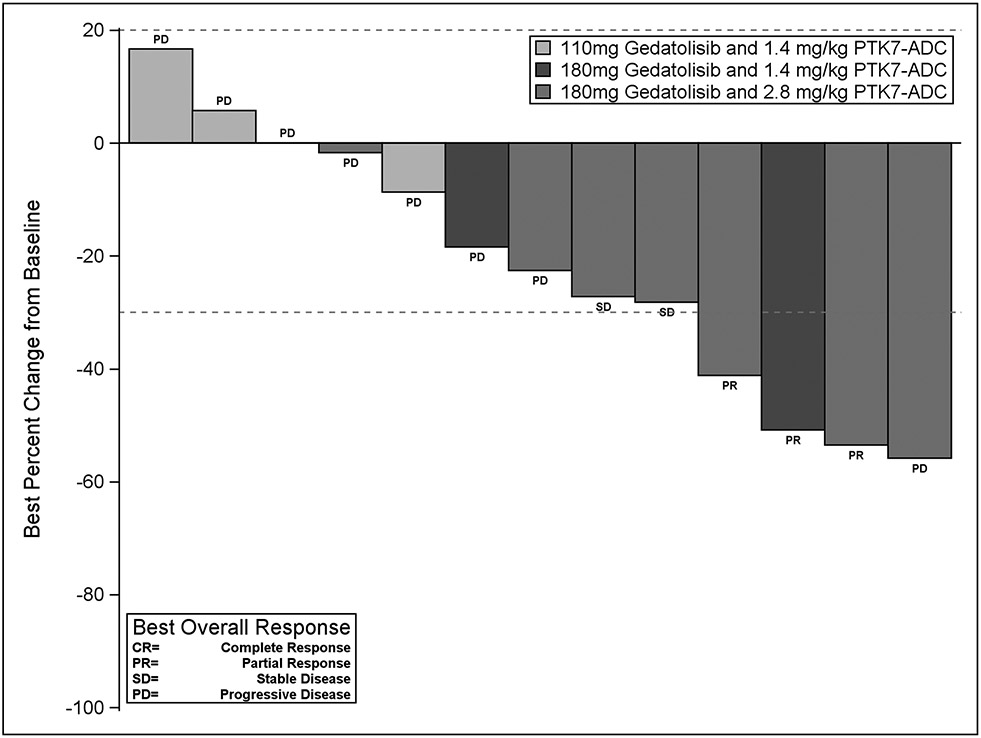
Figure 1.
Waterfall plot demonstrating best tumor response from baseline (y-axis). 18 pts enrolled on trial, 16 were evaluable for response, 13 pts with measurable disease reached at least the first pre-specified imaging timepoint for disease assessment. Pts are color-coded by dose cohort. PR=Partial Response; SD=Stable Disease; PD=Progressive Disease. Of note, the pt with best percent change for the target lesions, unfortunately, in the same visit had increasing/PD for the non-target lesions, resulting in overall best response as PD.

