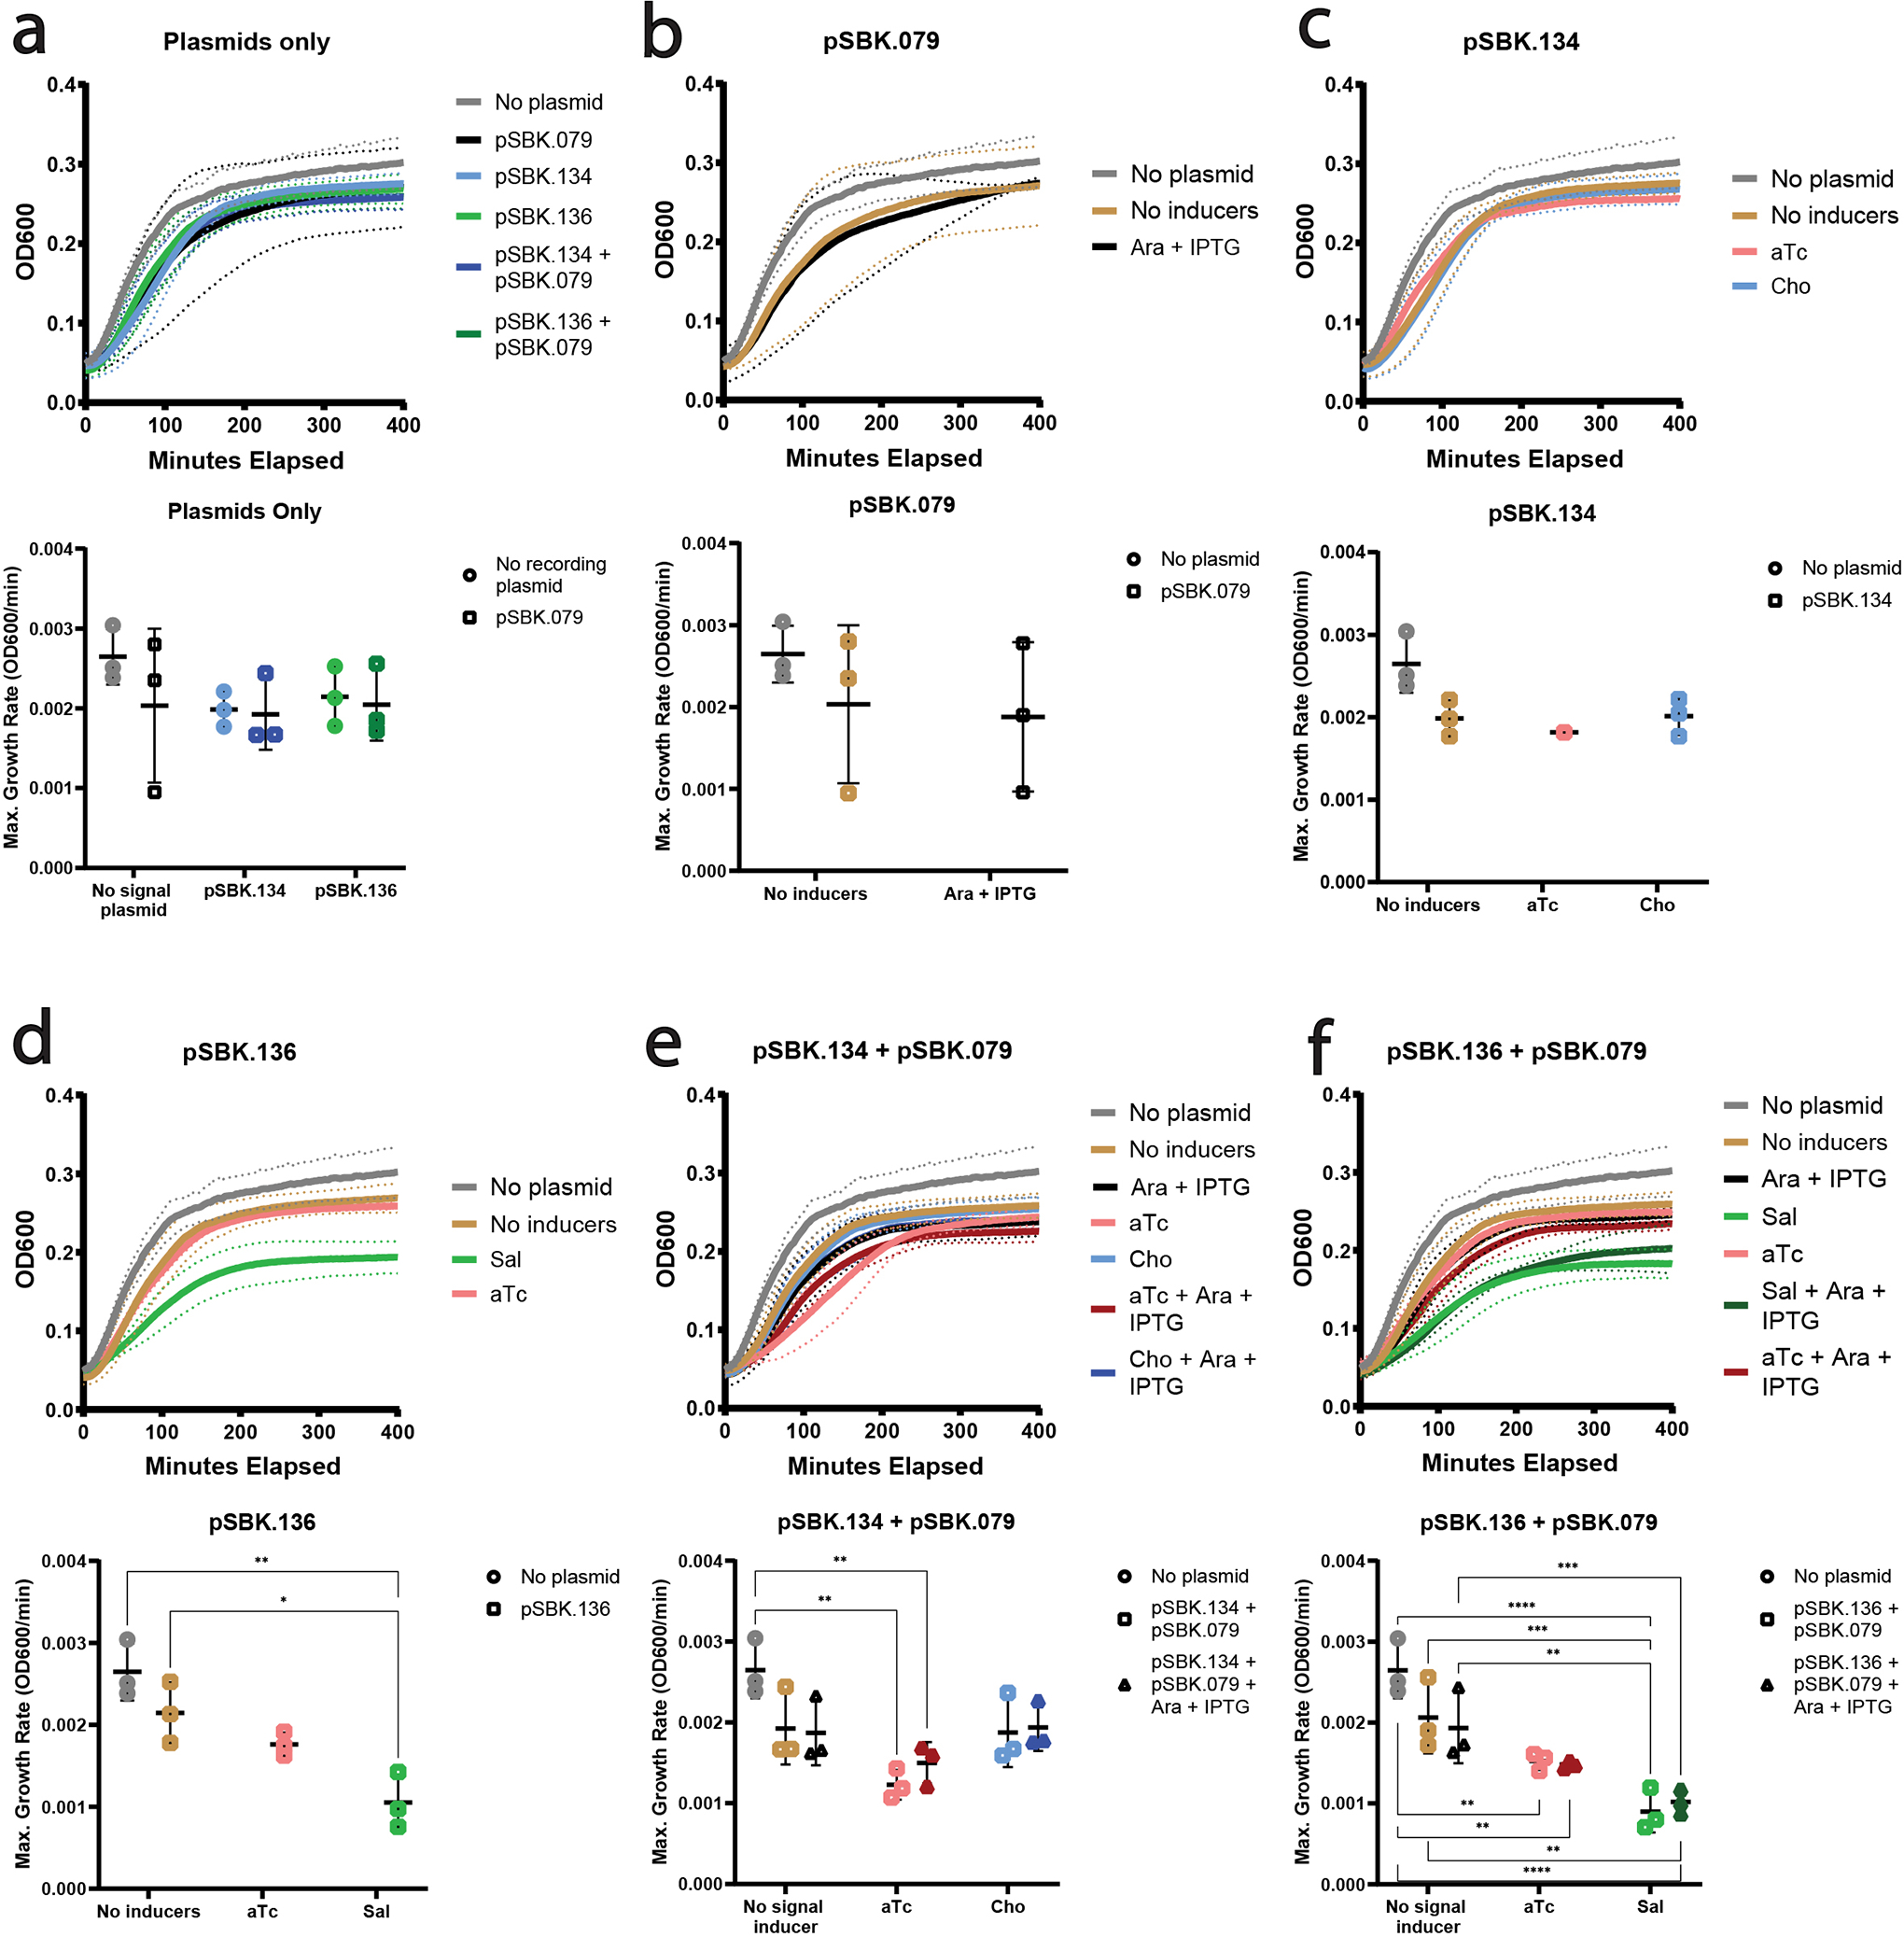
Extended Data Figure 5. Growth curves (upper plot) and max growth rates (lower plot) of E. coli with different combinations of retron recording components and inducers.

In growth curve plots the solid line is the mean OD600 of 3 biological replicates, with dotted lines showing the standard deviation. In maximum growth rate plots, each symbol is a single biological replicate. Bars show the mean and standard deviation. Statistically significant differences in maximum growth rate, as calculated by Tukey’s multiple comparison’s test, are highlighted. a. Growth kinetics of E. coli with different combinations of retron recording plasmids, all without inducers. b. Growth kinetics of E. coli with recording plasmid pSBK.079, with and without inducers. c. Growth kinetics of E. coli with signal plasmid pSBK.134, with and without inducers. Only one biological replicate is present in condition “pSBK.134 + aTc” (pink). d. Growth kinetics of E. coli with signal plasmid pSBK.136, with and without inducers. e. Growth kinetics of E. coli with signal plasmid pSBK.134 and recording plasmid pSBK.079, with and without inducers. f. Growth kinetics of E. coli with signal plasmid pSBK.136 and recording plasmid pSBK.079, with and without inducers.
