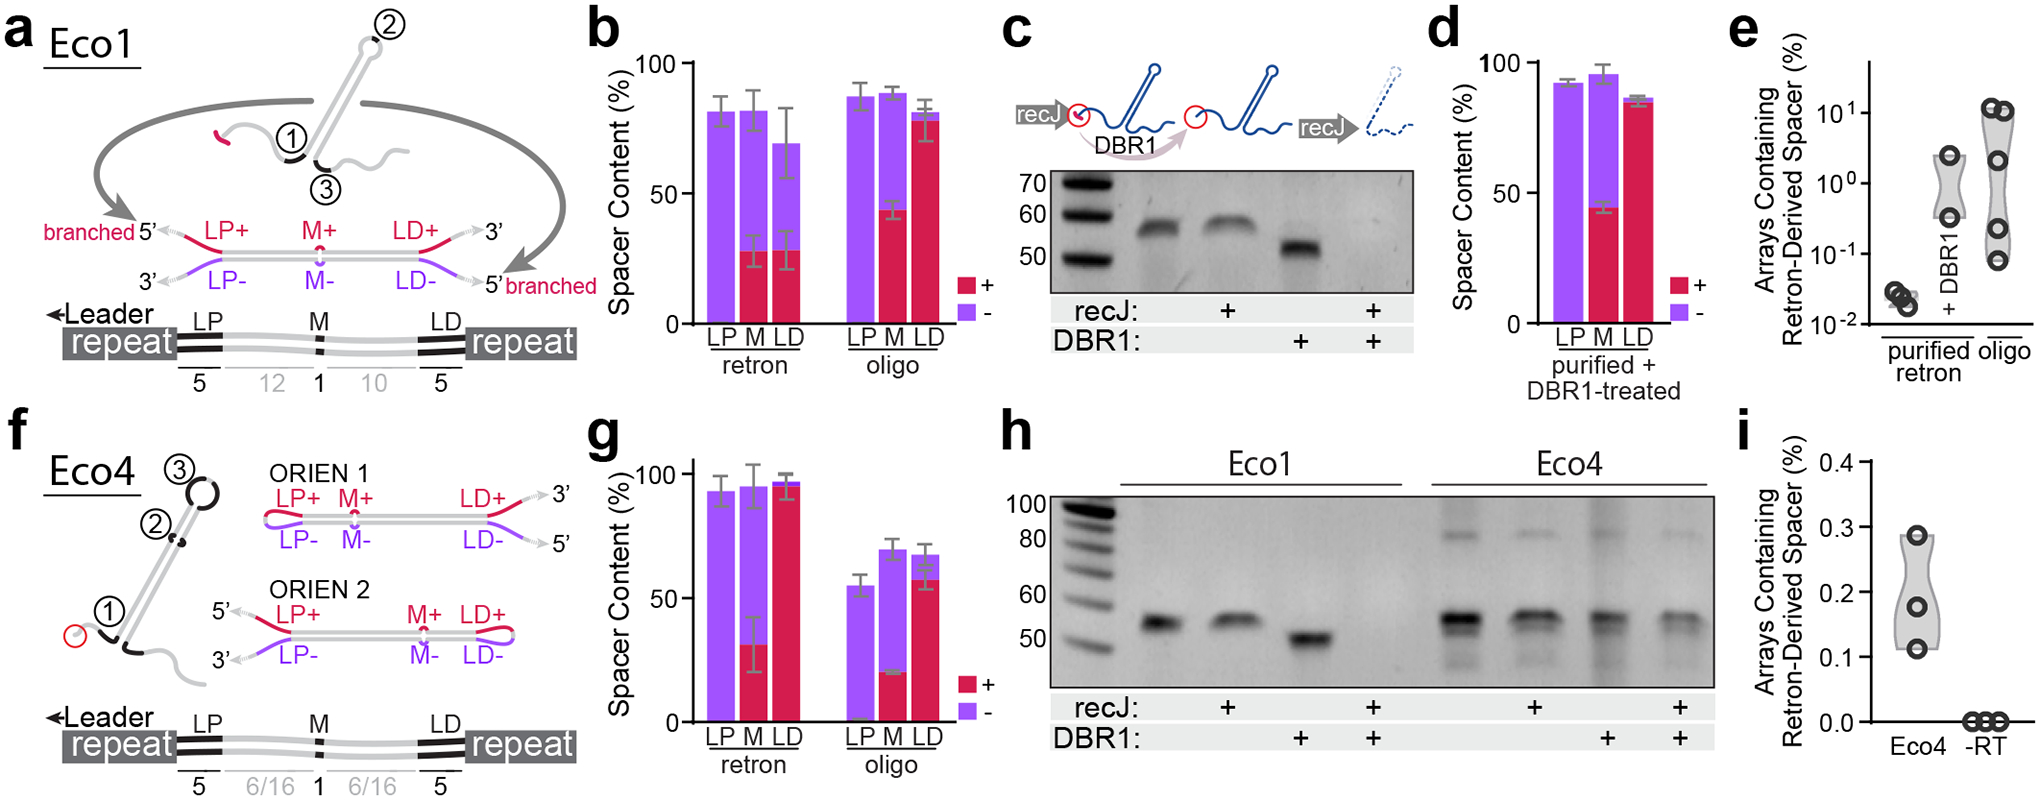
Figure 3. Mechanism of RT-DNA spacer acquisition.

a. Hypothetical structure of duplexed Eco1 v35 RT-DNA prespacer and retron-derived spacer, with mismatched regions highlighted. b. Quantification of mismatch region sequences in spacers from cells expressing Eco1 v35 versus cells electroporated with oligo mimic. Bars represent the mean of 4 and 5 biological replicates for the retron and oligo-derived conditions, respectively (±SD). c. Urea-PAGE visualization of Eco1 RT-DNA. DBR1 treatment resolves 2’–5’ linkage. For gel source data, see Supplementary Figure 1. d. Quantification of mismatch region sequences in spacers from cells electroporated with purified, debranched Eco1 v35 RT-DNA. Bars represent the mean of 4 biological replicates (±SD). e. Quantification of array expansions from different prespacer substrates. Open circles represent 3, 2, and 5 biological replicates (left-right). f. Schematic of Eco4 RT-DNA, in both orientations, with mismatch sequences highlighted. g. Quantification of mismatch region sequences in cells expressing Eco4 versus cells electroporated with oligo mimic. Bars represent the mean of 3 biological replicates (±SD). h. Urea-PAGE visualization of Eco4 RT-DNA. DBR1 does not cause size shift of Eco4 RT-DNA. For gel source data, see Supplementary Figure 1. i. Quantification of array expansions from retron Eco4. Open circles represent 3 biological replicates (left-right). All statistics in Supplementary Table 1.
