. 2022 Jun 23;10(8):932–946. doi: 10.1158/2326-6066.CIR-22-0040

Figure 4.

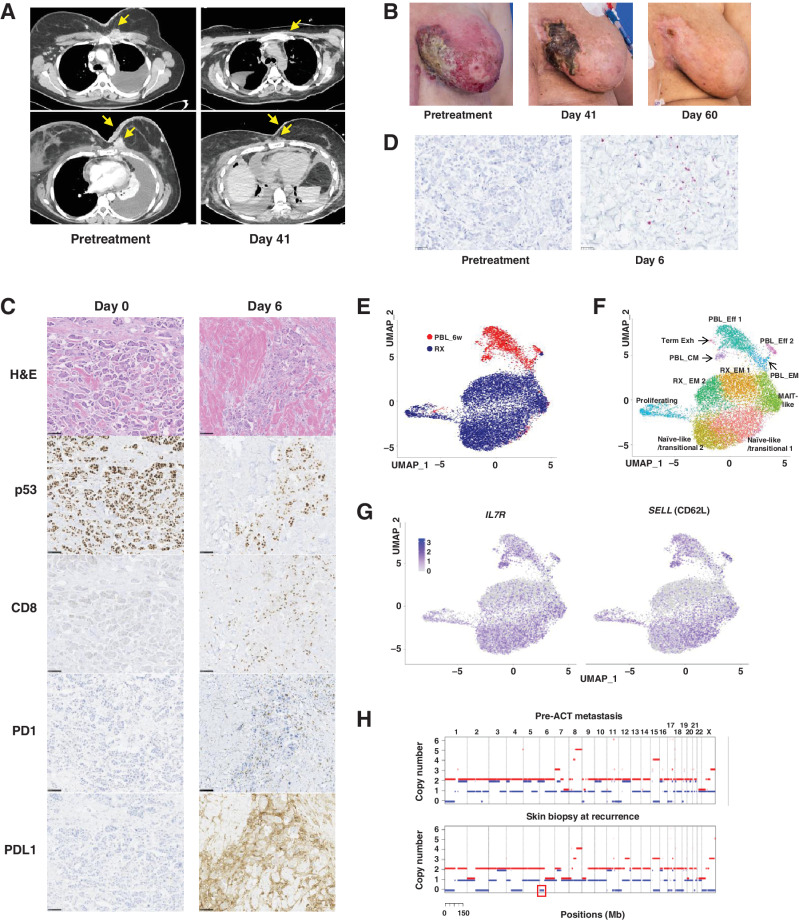
Figure 4. ACT with R175H-TCR–engineered autologous PBLs for the treatment of patient 4349 with chemorefractory breast cancer. A, Contrast-enhanced CT scans of the chest of patient 4349 before (left) and day 41 after the infusion of 5.3 × 10¹⁰ R175H-TCR–expressing PBLs (right). B, Pictures showing changes in metastatic skin deposits before the cell therapy (left), at day 41 (middle), and day 60 (right). C,) IHC analysis of the skin biopsies at day 0 before the cell therapy (left) and at day 6 (right). Scale bar, 100 μm. Following ACT, a decrease in tumor cell numbers and p53+ tumor cells and an increase in CD8+ T cells, PD-1+ T cells, and PD-L1+ tumor cells were detected. D, Detection of R175H-TCR+ T cells by RNAscope. Tumor-infiltrating T cells that expressed the R175H-TCR are visualized using an RNAscope probe against the MSGV1 3′ UTR. Each purple dot represents one RNA molecule. UMAP projection of 12,993 R175H-TCR+CD8+ T cells: 10,893 infusion product T cells (RX) and 2,100 6-week posttreatment PBLs (PBL_6w). E, UMAP clustering of single cells indicated by the sample source. F, Clustering based on whole transcriptome analysis. Phenotypic clusters are represented using different colors. G, Expression of indicated genes overlaid on the UMAP projection of RX cells and PBL_6w cells. H, Copy-number analysis of patient 4349′s pre-ACT metastasis tumor fragment 6 (top) and the skin biopsy at recurrence (bottom) by WES. LOH of chromosome 6 containing HLA-A*02:01 is highlighted in a red box. H&E, hematoxylin and eosin; Eff, effector T cells; EM, effector memory T cells; CM, central memory T cells; Term Exh, terminally exhausted T cells; MAIT, mucosa-associated invariant T cells.

ACT with R175H-TCR–engineered autologous PBLs for the treatment of patient 4349 with chemorefractory breast cancer. A, Contrast-enhanced CT scans of the chest of patient 4349 before (left) and day 41 after the infusion of 5.3 × 10¹⁰ R175H-TCR–expressing PBLs (right). B, Pictures showing changes in metastatic skin deposits before the cell therapy (left), at day 41 (middle), and day 60 (right). C,) IHC analysis of the skin biopsies at day 0 before the cell therapy (left) and at day 6 (right). Scale bar, 100 μm. Following ACT, a decrease in tumor cell numbers and p53+ tumor cells and an increase in CD8+ T cells, PD-1+ T cells, and PD-L1+ tumor cells were detected. D, Detection of R175H-TCR+ T cells by RNAscope. Tumor-infiltrating T cells that expressed the R175H-TCR are visualized using an RNAscope probe against the MSGV1 3′ UTR. Each purple dot represents one RNA molecule. E–F, UMAP projection of 12,993 R175H-TCR+CD8+ T cells: 10,893 infusion product T cells (RX) and 2,100 6-week posttreatment PBLs (PBL_6w). E, UMAP clustering of single cells indicated by the sample source. F, Clustering based on whole transcriptome analysis. Phenotypic clusters are represented using different colors. G, Expression of indicated genes overlaid on the UMAP projection of RX cells and PBL_6w cells. H, Copy-number analysis of patient 4349′s pre-ACT metastasis tumor fragment 6 (top) and the skin biopsy at recurrence (bottom) by WES. LOH of chromosome 6 containing HLA-A*02:01 is highlighted in a red box. H&E, hematoxylin and eosin; Eff, effector T cells; EM, effector memory T cells; CM, central memory T cells; Term Exh, terminally exhausted T cells; MAIT, mucosa-associated invariant T cells.