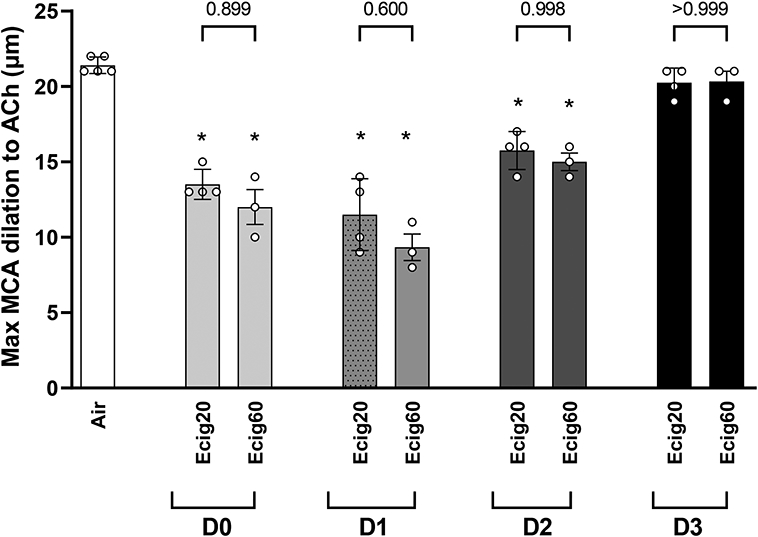
Figure 1.

Graph showing maximal response to ACh (i.e. 10-4 M) in middle cerebral arteries (MCA) between Ecig exposure groups (Ecig 20-puffs n=4 and Ecig 60-puffs n=3) compared to responses in controls (Air, n=5). MCA data for Ecig groups reflects number of (D)ays after exposure, and show no difference in response between Ecig 20- vs 60-puffs at any time point. *signifies different compared to Air (p<0.05). Mean±SD.
