
Figure 2.
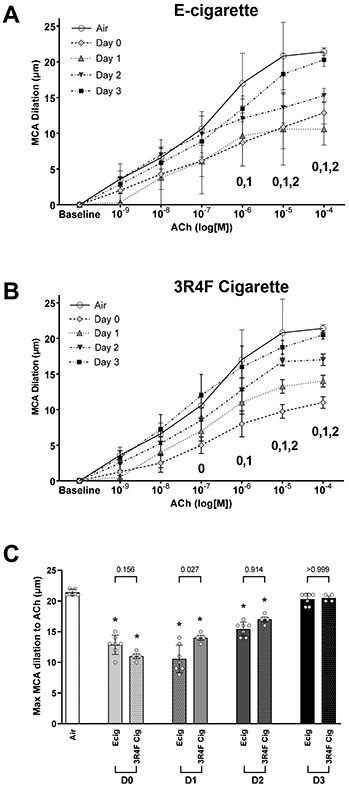
Middle cerebral arteries (MCA) reactivity assessed with ex vivo pressure myography. MCA dilation responses to increasing concentration of acetylcholine (ACh). Dose response curves reflects data corresponding to number of (D)ays after an exposure to either (A) Ecig (n=7) or (B) 3R4F Reference Cigarette (n=4) and compared to responses in controls (Air, n=5). Numeral notation in panel A & B indicates post hoc testing with significant difference (p<0.05) between Air vs Day 0 = “0”; Air vs Day 1 = “1”, and Air vs Day 2 = “2” for respective doses. (C) Summary graph showing maximal response to ACh (i.e., [10−4] data point from dose response curves in A & B) showing similar blunting and overall time course for vessel recovery between Ecig and 3R4F Cigarette. *signifies different compared to Air (p<0.05). Post-hoc testing also revealed no differences between respective Ecig and 3R4F Cigarette groups at all time points, except D1 where a small, but statistically significant, difference between exposure groups was seen. Mean±SD.