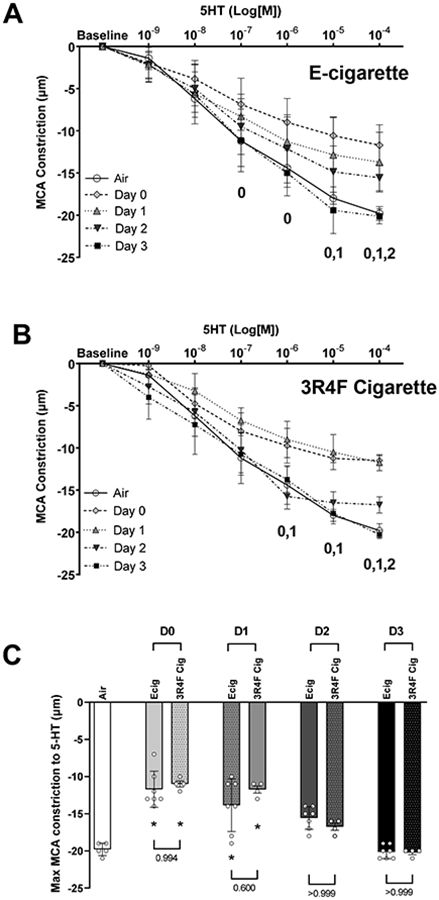
Figure 5.

Middle cerebral arteries (MCA) reactivity assessed with ex vivo pressure myography. Data shows MCA constriction response to increasing concentration of serotonin (5-HT). Dose response curve reflects data corresponding to number of (D)ays after an exposure to either (A) Ecig (n=7) or (B) 3R4F Reference Cigarette (n=4) and compared to responses in controls (Air, n=5). Numeral notation in panel A & B indicates post hoc testing with significant difference (p<0.05) between Air vs Day 0 = “0”, Air vs Day 1 = “1”, vs Air and Day 2 = “2”. (C) Summary graph showing maximal response to SNP (i.e., [10−4] data point from dose response curves in A & B) showing no difference in overall time course to vessel recovery between Ecig and 3R4F Cigarette. * signifies different compared to Air (p<0.05). Post-hoc testing also revealed no differences between respective Ecig and 3R4F Cigarette groups at any time point. Mean±SD.
