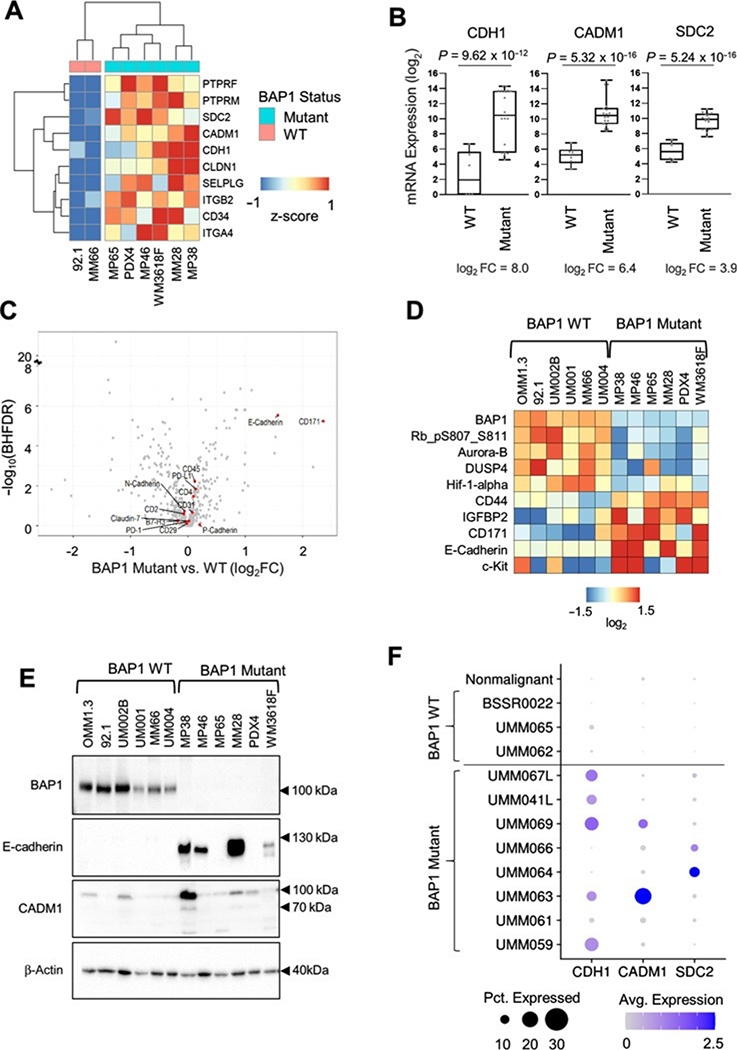
Figure 2.
BAP1 mutant and wild-type uveal melanoma cell line panel shows differential expression of CDH1, CADM1, and SDC2. Differential expression analysis of RNA-seq data from triplicates of six BAP1 mutant (MM28, MP38, MP46, MP65, WM3618F, and PDX4) and two BAP1 wild-type cell lines (92.1 and MM66) was performed using DESeq2. A, A heatmap showing average expression of six BAP1 mutant and two wild-type cell lines for the top 10 positively enriched KEGG CAMs pathway genes. B, Box plots of CDH1, CADM1, and SDC2 mRNA expression in BAP1 mutant (n ¼ 18) versus wild-type (n ¼ 6) cell line samples. C, A volcano plot showing antibodies targeting genes from the KEGG CAM pathway from the RPPA data. D, A heatmap of median-centered, log2-transformed RPPA data for the top and bottom five proteins ranked by the product of the fold change and log10(Benjamini–Hochberg FDR), when comparing BAP1 mutant versus wild-type cell lines. Each cell line was done in triplicate. Proteins are ordered on the basis of hierarchical clustering. E, Uveal melanoma cell line panel showing expression of E-cadherin and CADM1 in BAP1 wild-type versus mutant cell lines. F, Dot plot showing the average expression and percent of cells expressing CDH1, CADM1, and SDC2 from patient tumor scRNA-seq data. Cells were separated into on malignant and tumor-specific malignant cell groups.

