Figure 4.
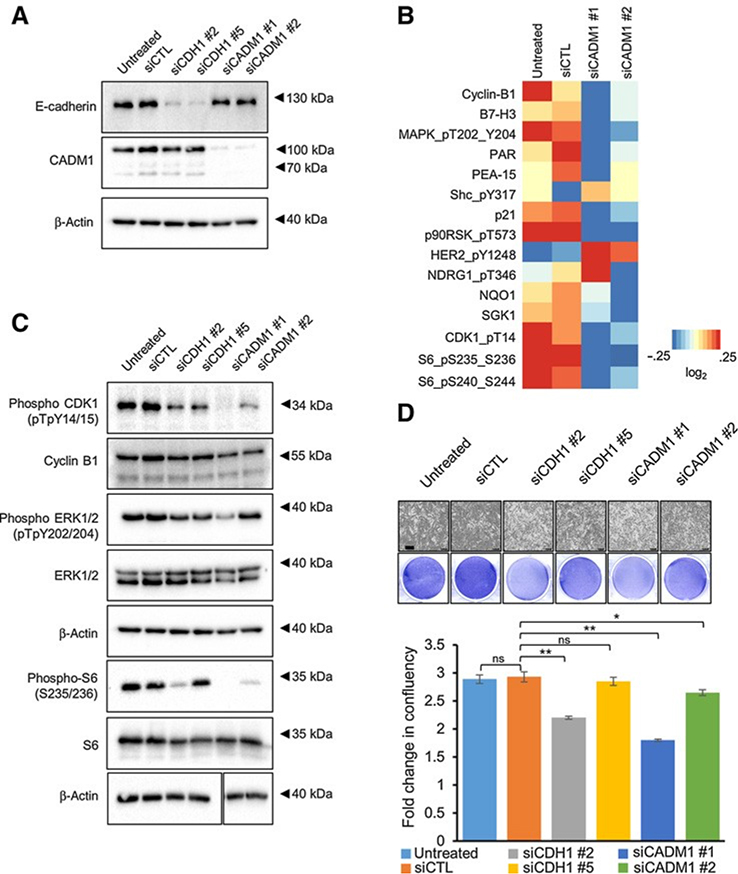
Knockdown of CDH1 and CADM1 decreases cell cycle– and cell growth–associated protein expression. A, Western blot analysis was used to validate E-cadherin and CADM1 expression levels with either control, CDH1, or CADM1 siRNAs in MP38 cells. B, A heatmap of median-centered, log2-transformed RPPA data for the top proteins (P < 0.05, log2fc > 0.32193) when comparing siCADM1 cells with untreated and siCTL. Each lysate was collected in triplicate (n 3). C, Representative Western blot analysis showing the effect of E-cadherin and CADM1 knockdown on cell-cycle and cell growth proteins. Identical lysates from A were used for the first four blots (phosphoCDK1, cyclin B1, phosphoERK1/2, and ERK1/2), and so the top b-actin loading control was duplicated from A. D, Effect of siCDH1 and siCADM1 on MP38 cell growth was analyzed using the IncuCyte Live Cell Analysis Imaging System. Scale bars, 300 mmol/L. Fold change was calculated as percent confluency compared with day 0, % inhibition was calculated as fold change difference as compared with control, P < 0.05, and P < 0.01 as determined by t test, and error bars are ±SEM.

