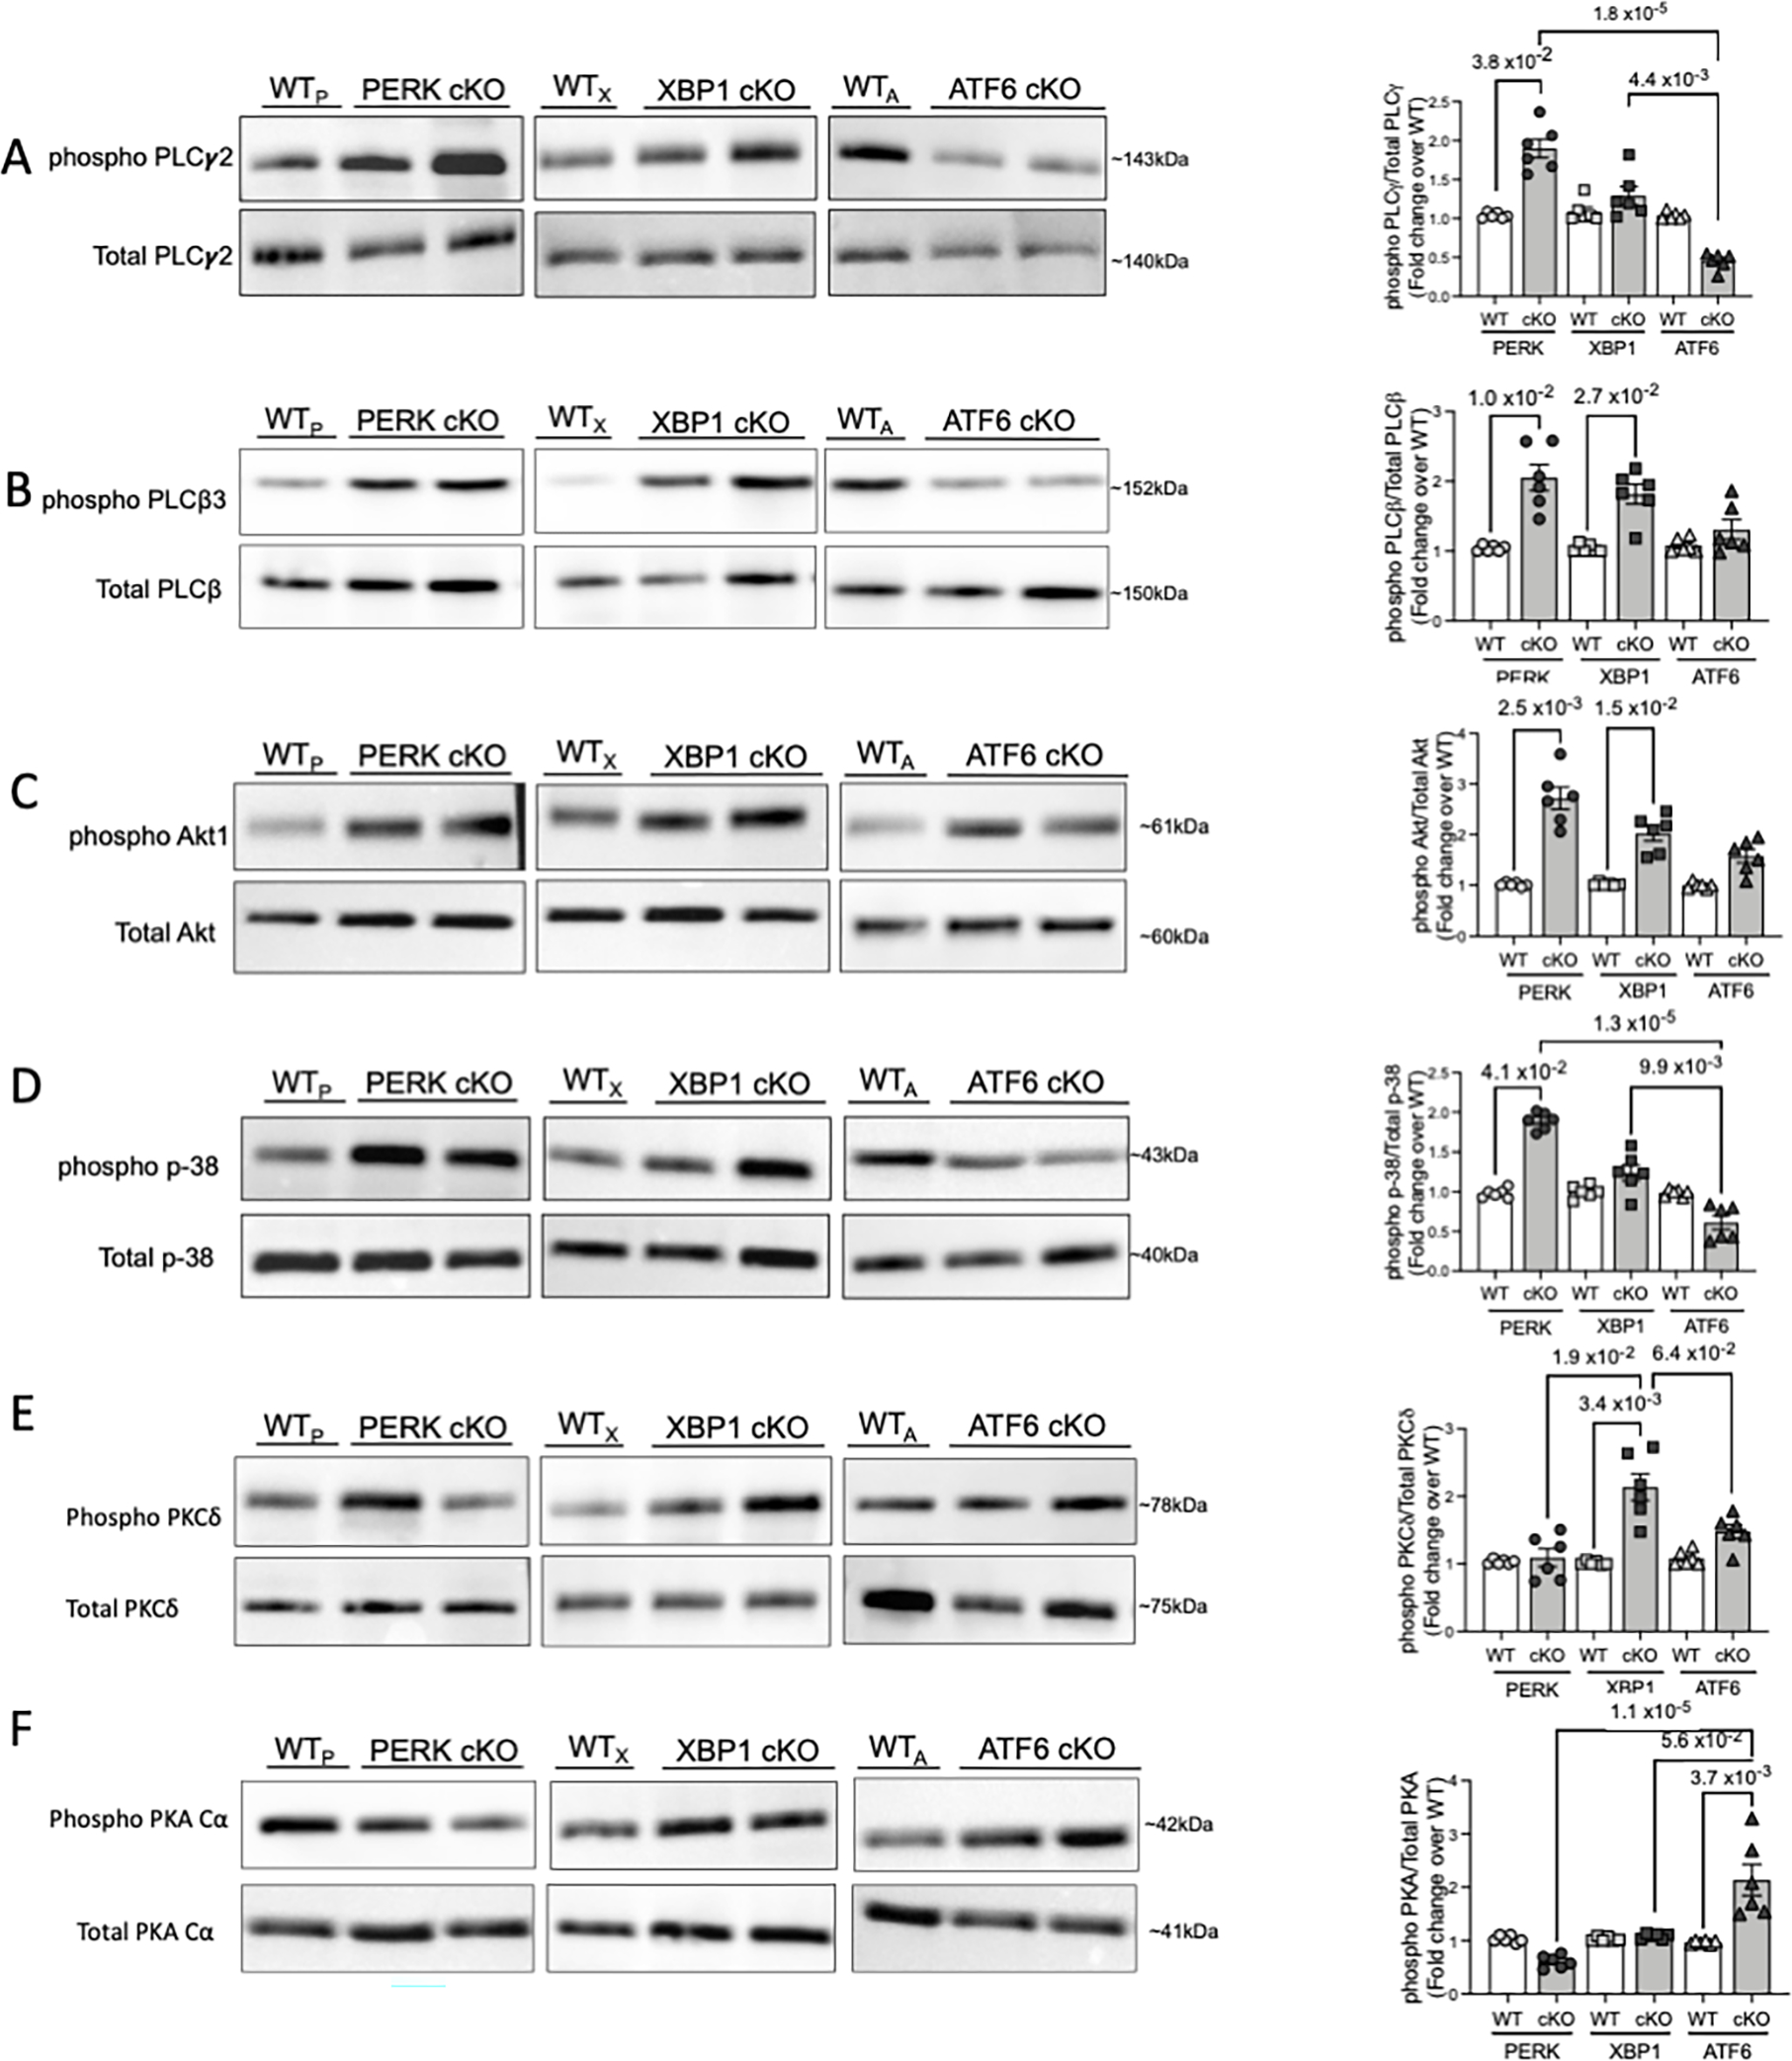
Figure 4: Platelet-specific deletion of UPR genes selectively affects specific platelet activation pathways.

Platelets (3 × 10⁸ per mL) from each of the mouse strains were lysed using RIPA buffer, resolved on SDS PAGE and immunoblotted for respective proteins. A total of n=10 mice (n=4 males, n=6 females) per strain and respective littermate controls used for platelet activation signaling responses. Immunoblotting and respective quantitation for A. phospho- PLCγ2 and total PLCγ2. B. phospho PLCβ3 and Total PLCβ3. C. phospho-Akt1 and Total Akt. D. phospho-p38 and Total p-38. E. phospho-PKCδ and Total PKCδ. F. phospho-PKA Cα and total PKA Cα. Quantification of immunoblotting reflects the results from n=6 WTP and n=6 PERK cKO, n=6 WTX and n=6 XBP1 cKO, n=6 WTA and n=6 ATF6 cKO mice respectively. Data presented as mean ± SEM. Precise p value corresponds to Kruskal-Wallis test with Dunn’s multiple comparisons.
