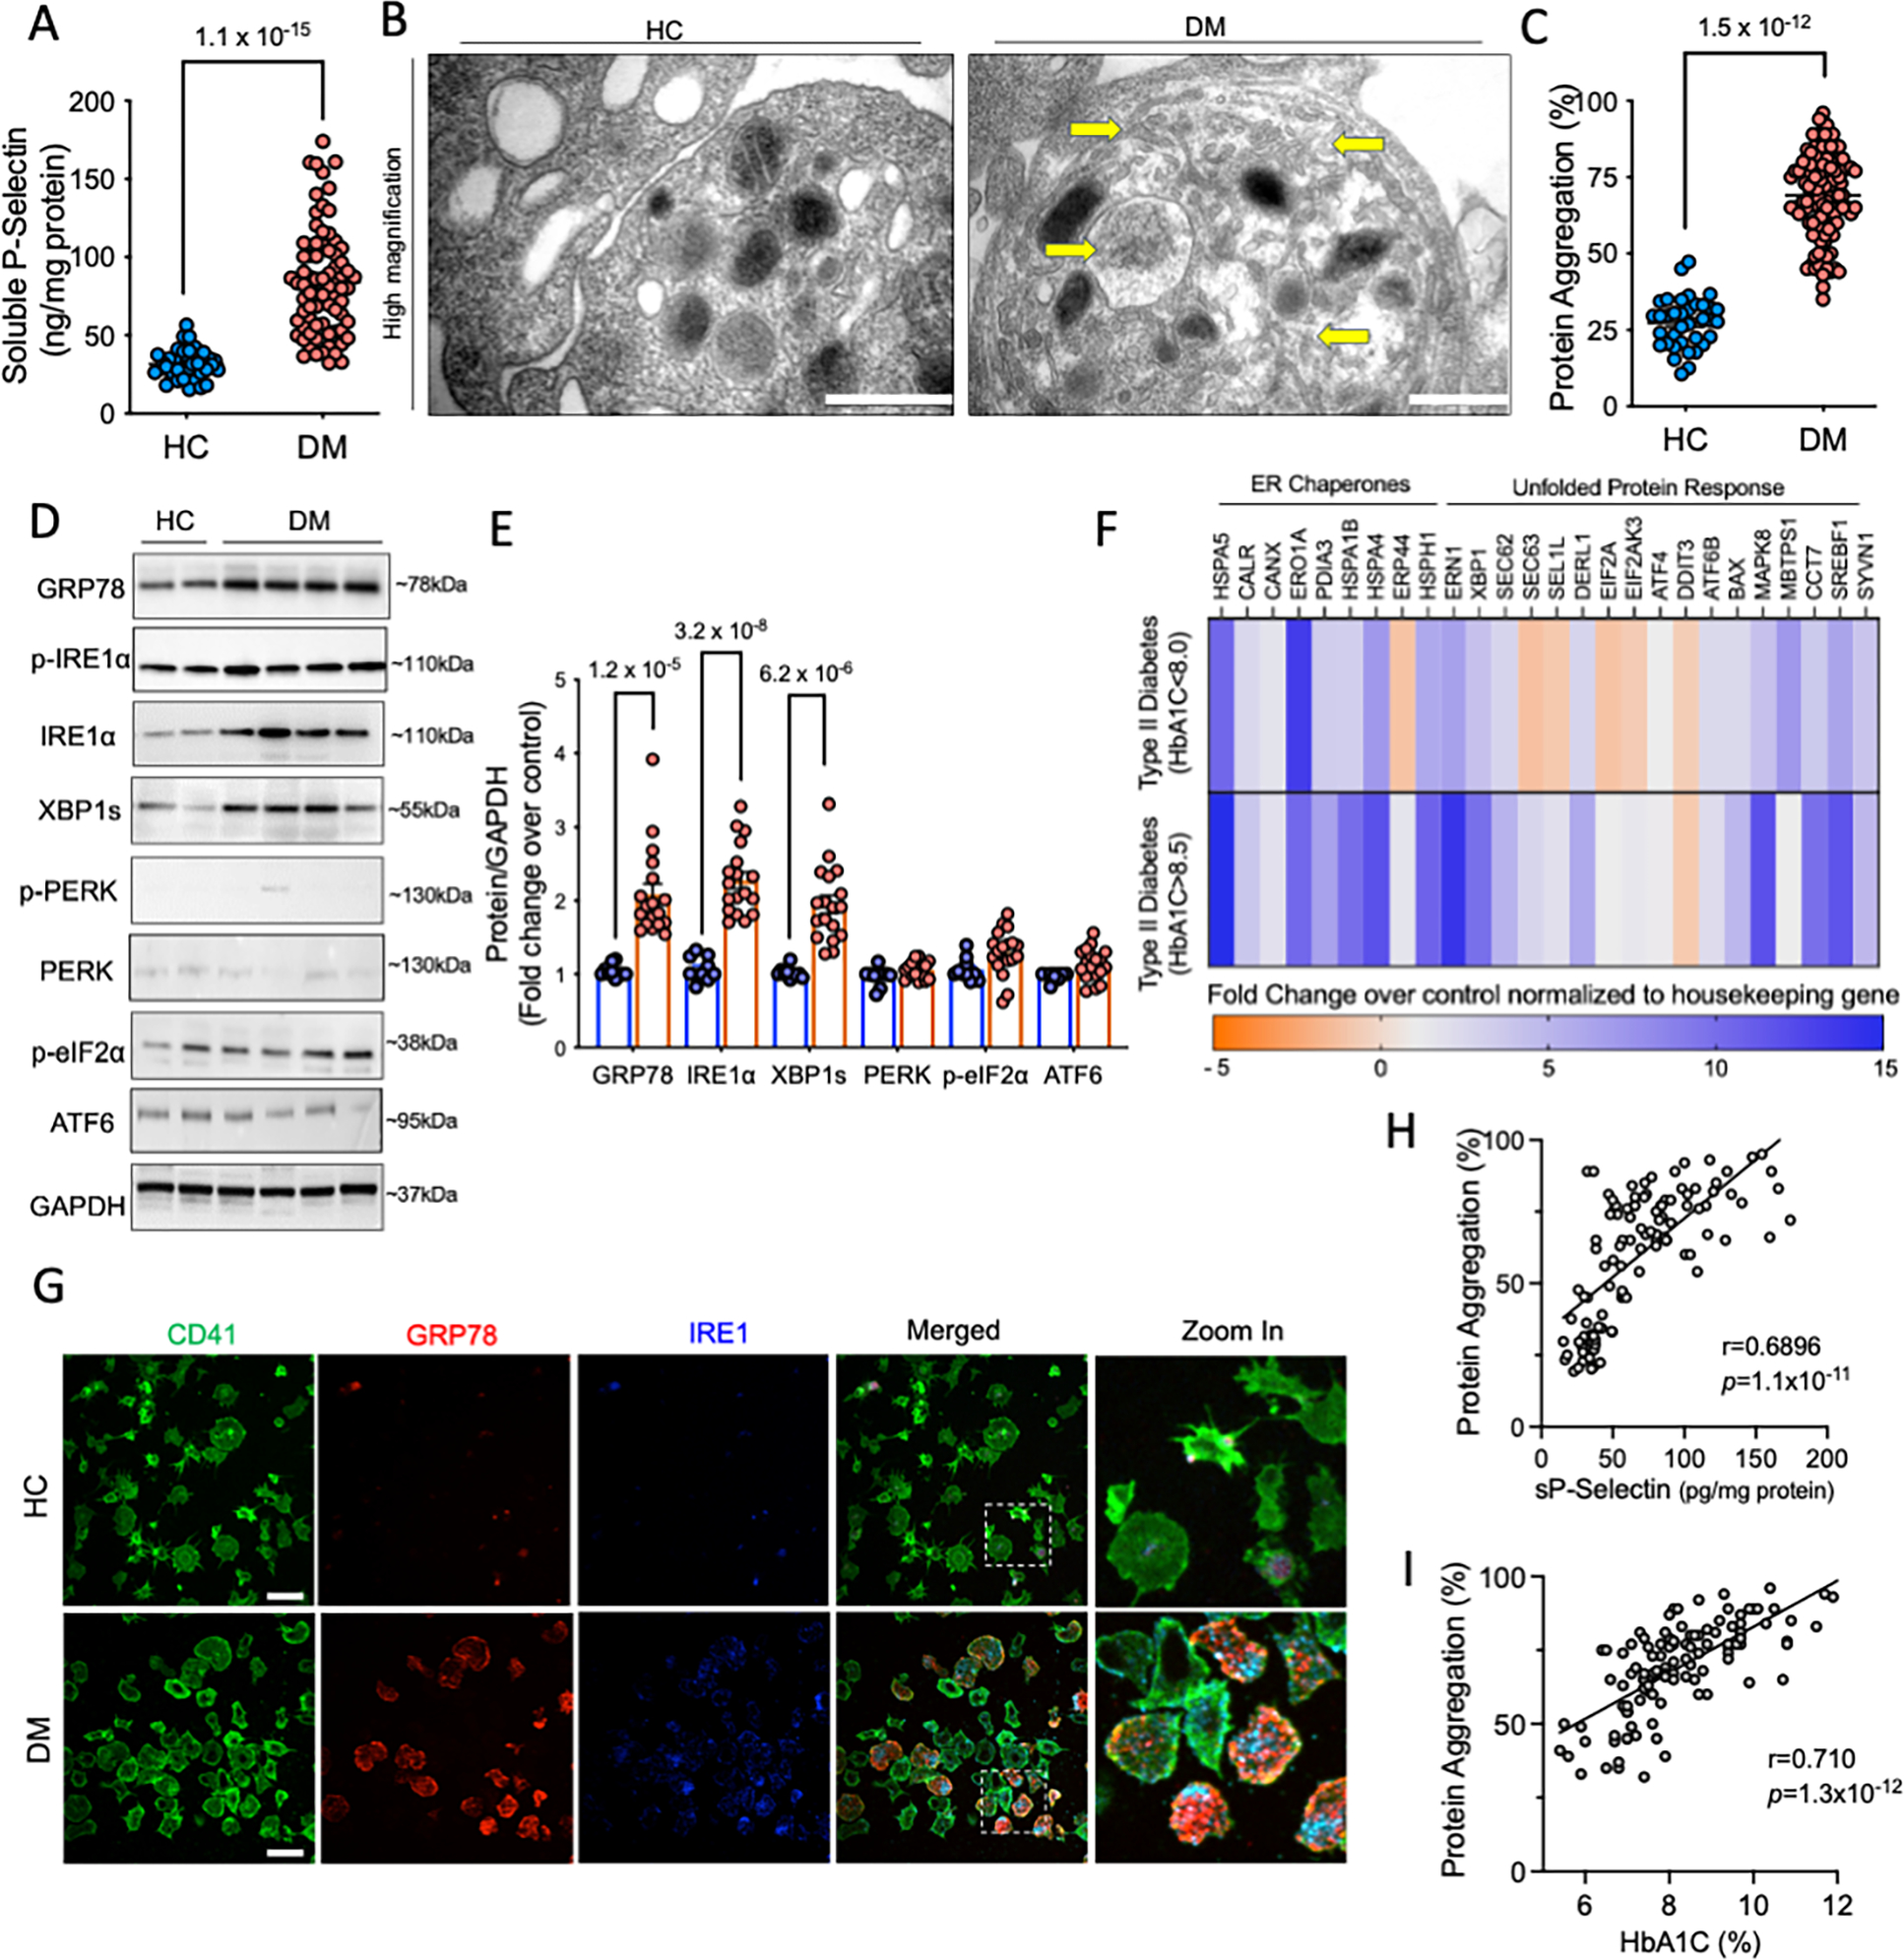
Figure 6: Diabetes mellitus selectively activates IRE1α in platelets.

Freshly isolated platelets from DM patients (n=102) were compared to healthy age matched controls(HC), processed simultaneously. A. Levels of soluble P-selectin in DM (n=75) and controls (n=38). B. Representative TEM from DM and HC platelets, acquired on FEI Tecnai Biotwin (LaB6, 80 kV). Arrows highlight presence of protein aggregates and ER expansion within DM platelets. Scale bar, 500 nm. Data representative of n=3 independent experiments. Lower magnification shown in Supplemental Figure S10. C. Protein aggregation in DM (n=102) and HC platelets (n=40) measured using the Proteostat Dye. D-E. Platelets (3 × 10⁸ per mL) were used for immunoblotting. Representative immunoblots and quantification for expression of UPR pathway proteins in HC (n=10) and DM (n=18) samples. F. Heat map shows differential expression of key ER stress/UPR genes measured and quantified using the RT2 Profiler Human Unfolded Protein Response PCR array. Heat map represents fold change in patients with less (HbA1c<8.5) and more (HbA1c>8.5) severe diabetes. Results normalized to housekeeping genes and expressed over HC. n=6 each, for HC and DM platelets. Validation by qPCR for UPR genes shown in Supplemental Figure S11. G. Confocal microscopy images from DM and control platelets (green, CD41) stained for IRE1α (blue) with GRP78 (red). Zoom in as shown by dotted line shows expression in individual platelets. Images acquired on Perkin Elmer 5-Laser Spinning Disk Confocal Microscope (equipped with Nikon Ti-E Eclipse inverted microscope), 100X (oil) objective. Microscopy images representative of n=3 independent experiments. Platelet counts adjusted between samples prior to staining. Scale bar, 10 μm H. Pearson’s correlation between protein aggregates and P-selectin. I. Pearson’s Correlation between protein aggregates and HbA1c (%), an indicator of the severity of diabetes. Values expressed as mean ± SEM. Precise p value corresponds to Mann Whitney test (A) and Student’s t test (C, E). See also Supplemental Data Table 1 and Supplemental Figure S10–12
