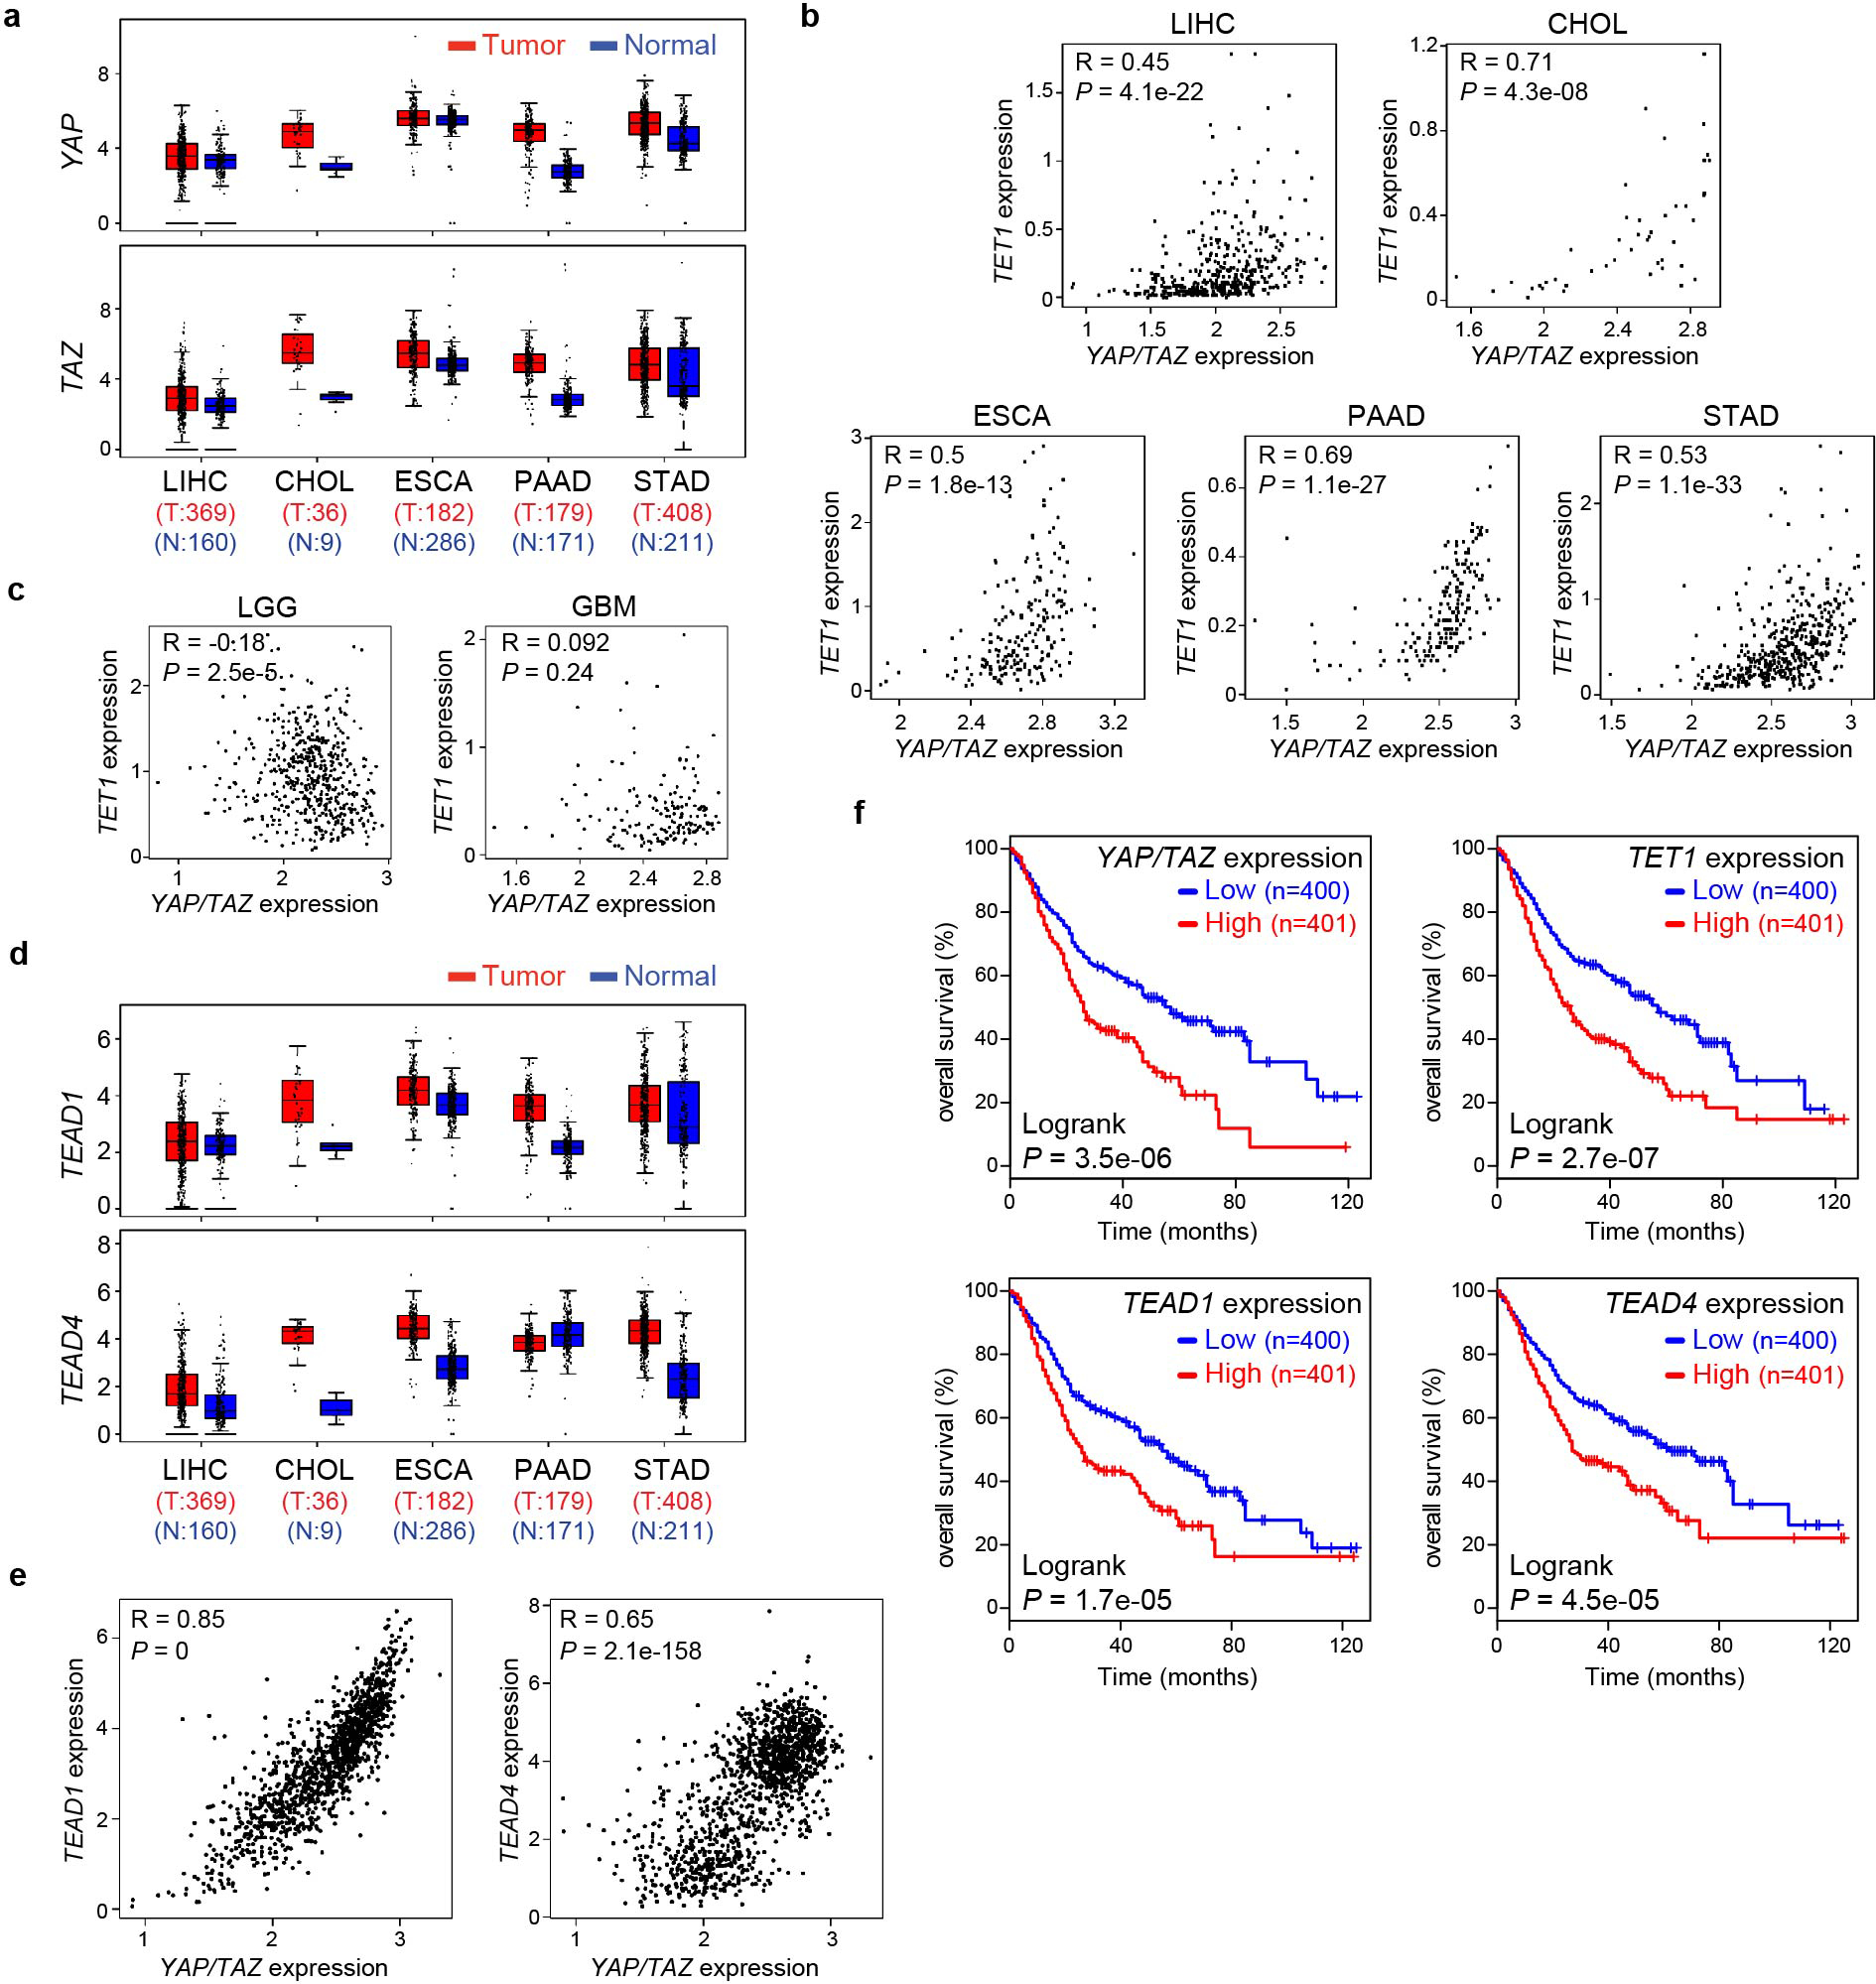
Extended Data Fig. 3. Elevated YAP/TAZ and TET1 abundance in foregut cancers shows a significant and positive correlation.

a, Elevated expression of YAP and TAZ in five human cancers (LIHC, CHOL, ESCA, PAAD and STAD) obtained from the TCGA database. The center lines show the medians, the box limits mark the 25th to the 75th percentiles and the whiskers indicate 1.5× the interquartile range. b, c, Spearman’s correlation coefficient analysis between the expression of YAP/TAZ and TET1 in LIHC, CHOL, ESCA, PAAD, STAD (b), LGG and GBM (c). d, Elevated expression of TEAD1 and TEAD4 in human foregut cancers (LIHC, CHOL, ESCA, PAAD and STAD) obtained from the TCGA database. e, Spearman’s correlation coefficient analysis between the expression of YAP/TAZ and TEAD1 (left panel) or TEAD4 (right panel) in human foregut cancers (LIHC, CHOL, ESCA, PAAD and STAD) obtained from the TCGA database. f, Kaplan-Meier analysis of overall survival in patients with human foregut cancers (LIHC, CHOL, ESCA, PAAD and STAD) according to high or low mRNA expression of YAP/TAZ, TET1, TEAD1 or TEAD4. P values are calculated with two-tailed Spearman’s correlation test (b, c, e) or two-sided log-rank test (f).
