
Extended Data Fig. 7. TET1 interacts with TEAD4 transcription factor to cause regional histone acetylation and chromatin opening at the rDMRs of canonical YAP target genes.
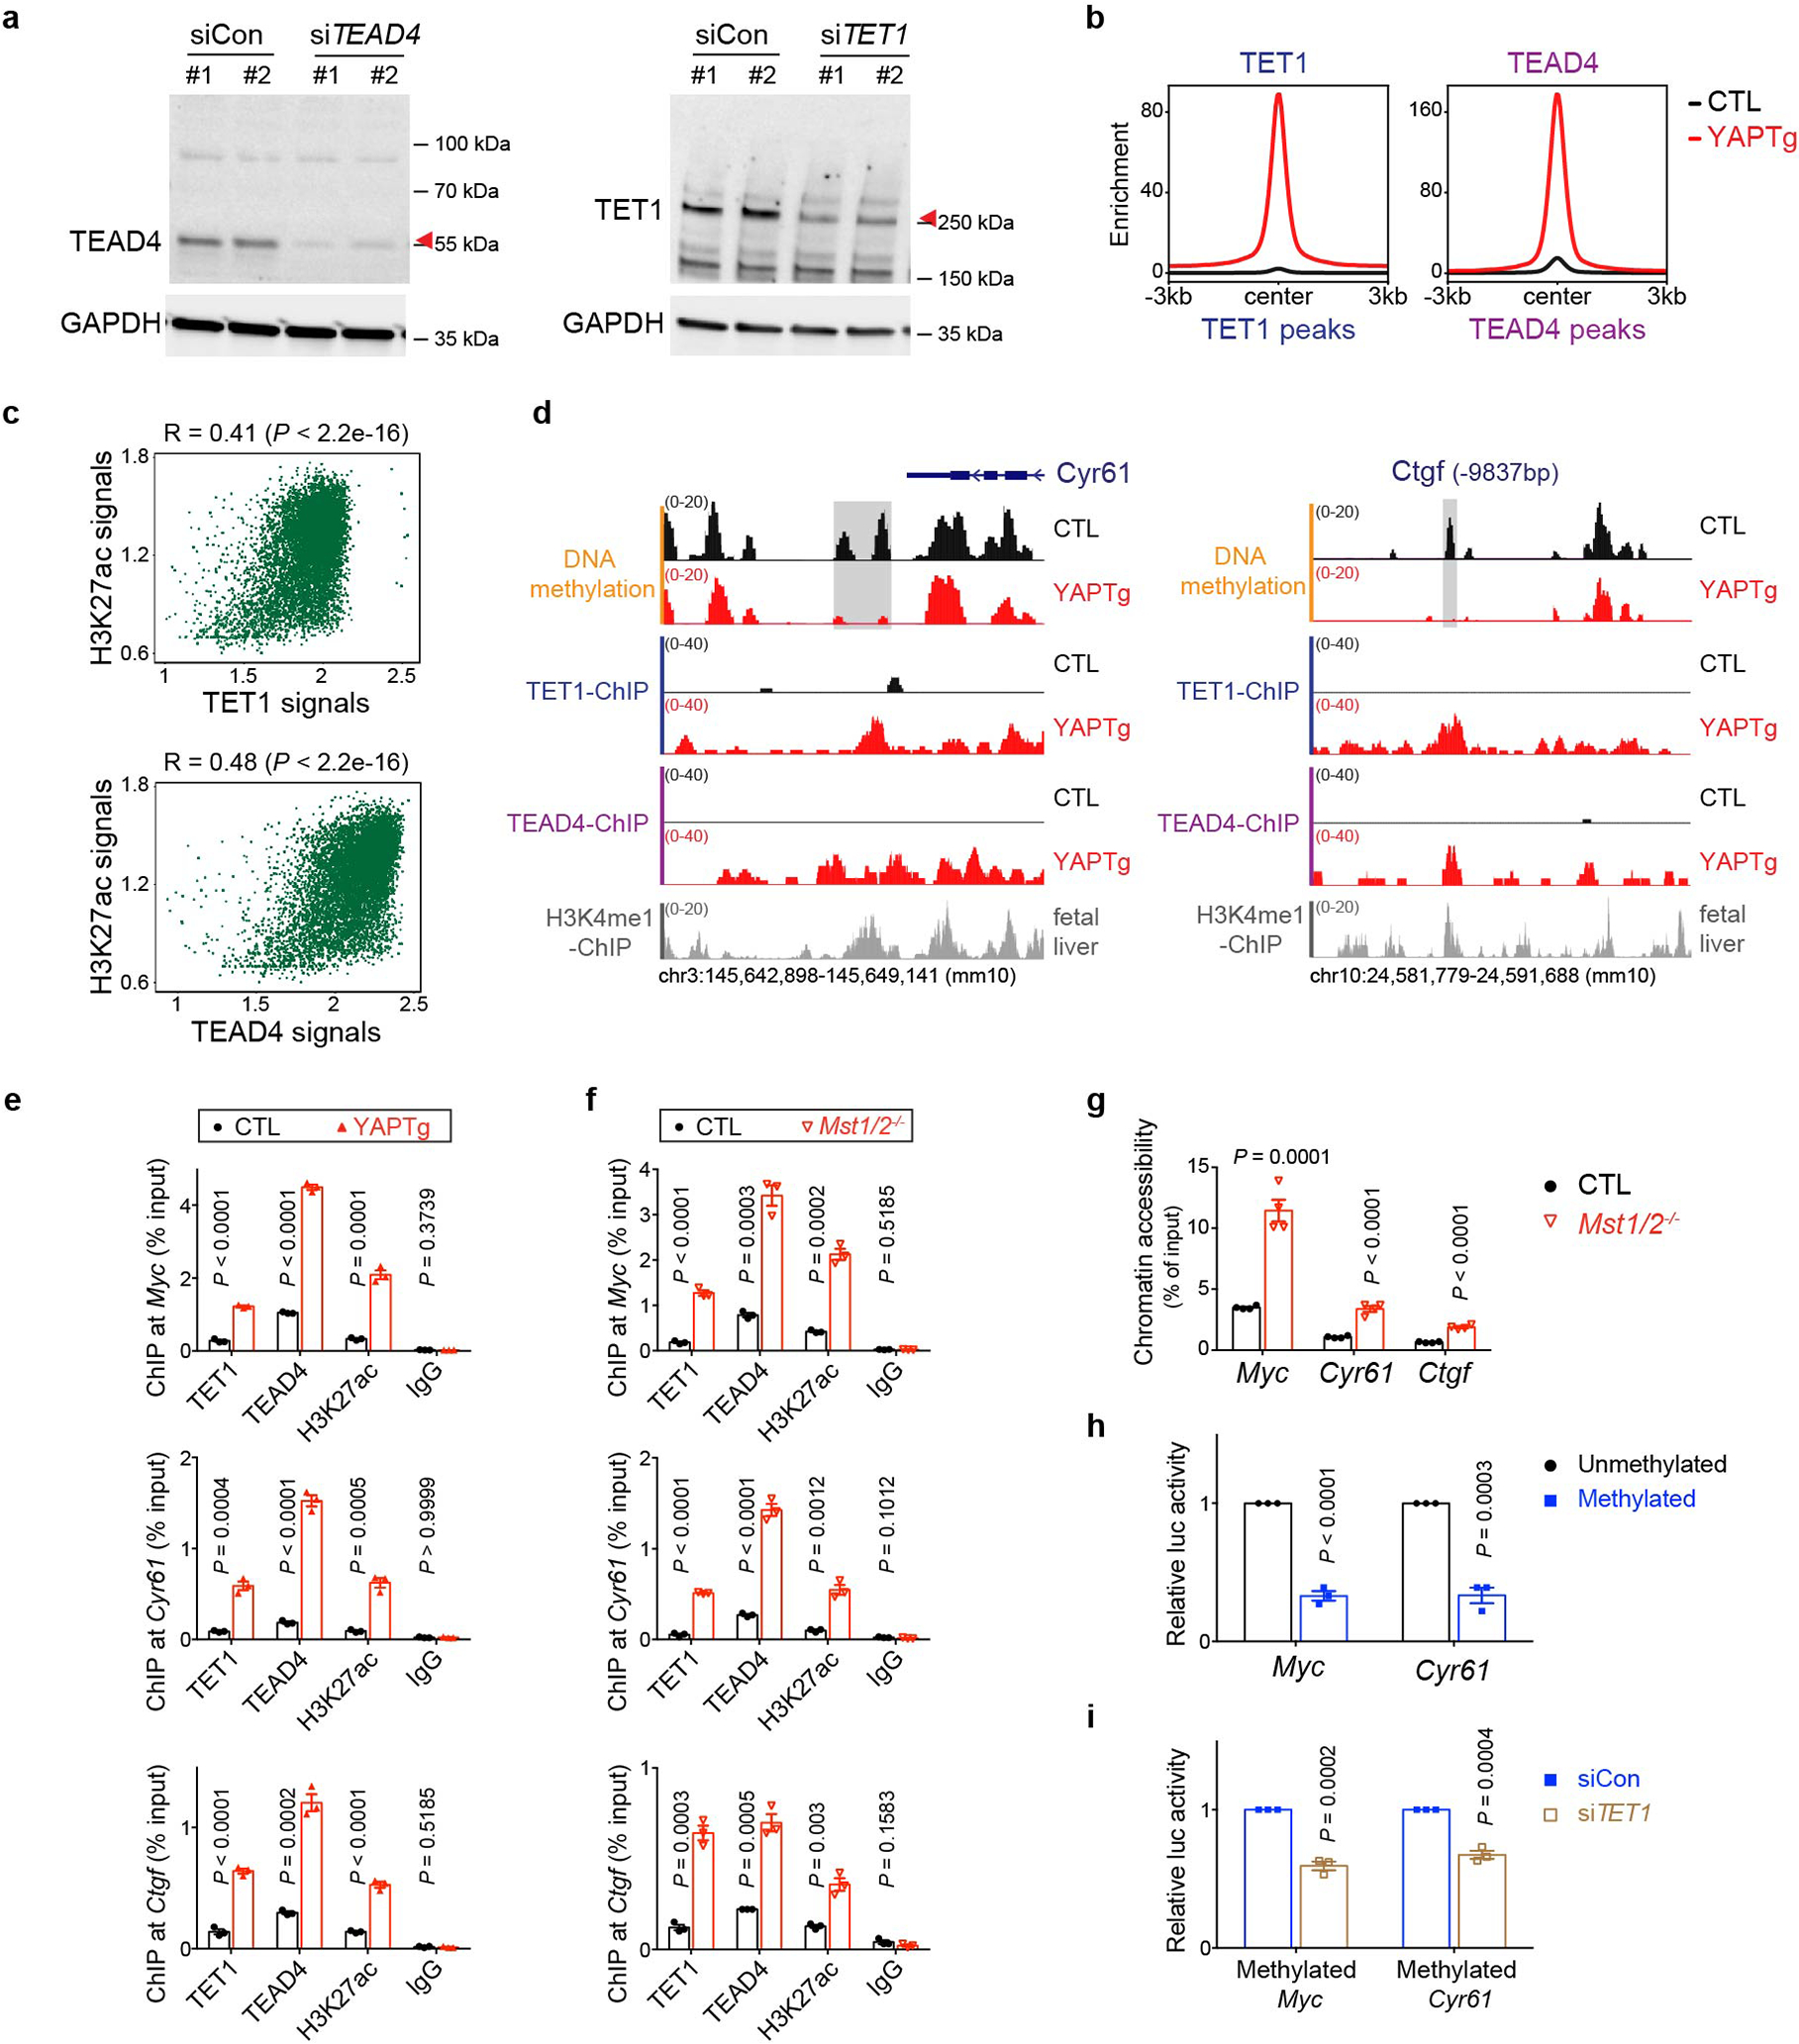
a, Validation of TEAD4 and TET1 antibody specificity. Western blot of TEAD4 or TET1 protein in HEK293T cells with non-targeting control (siCon) or siRNA targeting TEAD4 (siTEAD4) or siRNA targeting TET1 (siTET1) treatment. Images are representative of two independent experiments. b, Enrichment profiles representing the TET1 ChIP-seq reads from control and YAPTg livers centered at TET1 peaks (left panel) and the TEAD4 ChIP-seq reads from control and YAPTg livers centered at TEAD4 peaks (right panel). c, Spearman’s correlation coefficient analysis using the signals of peaks between H3K27ac and TET1 or TEAD4 from the identified 8,022 TET1/TEAD4/H3K27ac overlapped peaks. d, Genomic tracks displaying MBD-seq and ChIP-seq reads at the rDMR loci of Cyr61 and Ctgf. Grey columns represent YAP-induced rDMR regions. e, ChIP-qPCR at rDMRs in YAPTg livers (n = 3). f, g, ChIP-qPCR (n = 3) (f) and FAIRE-qPCR (n = 4) (g) at rDMRs in Mst1/2 mutant livers. h, Luciferase reporter assay showing enhancer activity of unmethylated and methylated Myc and Cyr61 rDMRs of three independent experiments. Reporter construct containing respective rDMRs with or without in vitro methylation was co-transfected with YAP-expressing vector into HEK293T cells. Luciferase activity was normalized to unmethylated rDMR. i, Luciferase reporter assay showing enhancer activity of methylated Myc or Cyr61 rDMR with non-targeting control (siCon) or siRNA targeting TET1 (siTET1) of three independent experiments. Reporter construct containing methylated rDMR was co-transfected with YAP-expressing vector together with either non-targeting control or siRNA targeting TET1 into HEK293T cells. Luciferase activity was normalized to non-targeting control. Values represent mean ± s.e.m. (e, f, g, h, i). P values are calculated with unpaired two-tailed Student’s t-test (e, f, g, h, i) or two-tailed Spearman’s correlation test (c).