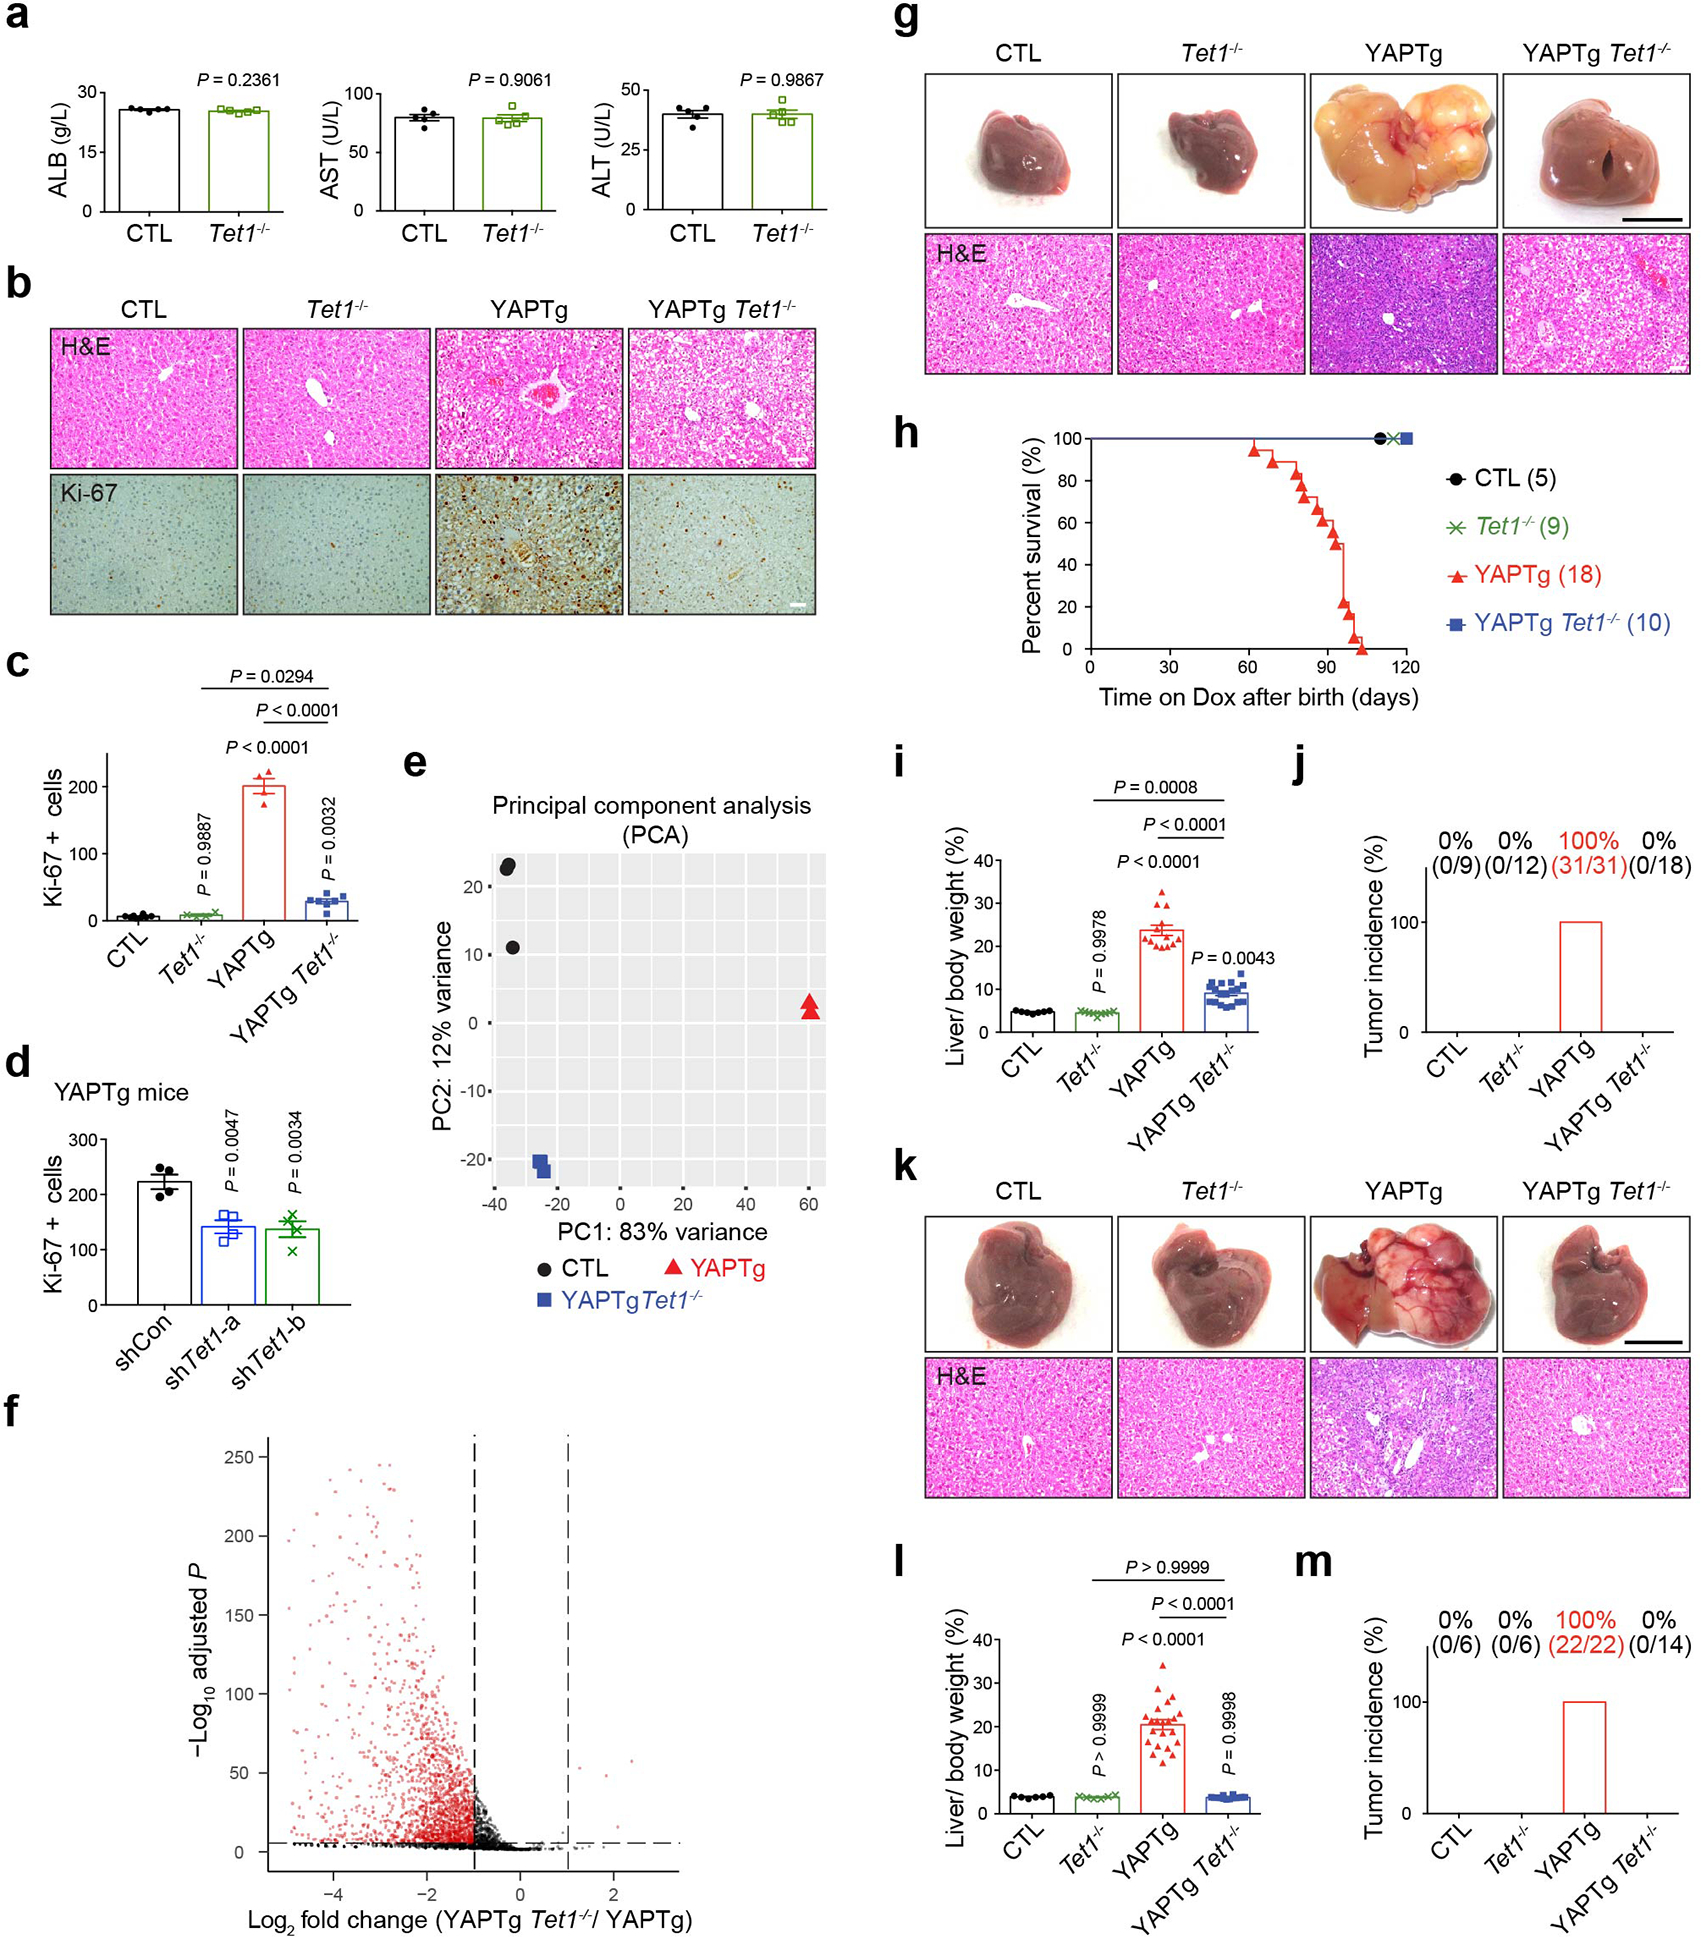
Extended Data Fig. 8. Loss of Tet1 suppresses YAP-induced hepatomegaly and tumorigenesis.

a, Normal liver function in Tet1 mutant mice, as indicated by similar serum levels of ALB, AST and ALT compared to control mice (n = 5). b, c, Representative H&E and Ki-67 staining of liver sections (b) and quantification of Ki-67 positive cells (c) from the indicated mice (n = 4) treated with Dox for 10 days starting at 1 month of age. d, Quantification of Ki-67 positive cells in YAPTg livers treated with Tet1 shRNA lentivirus (n = 4). e, Principal components analysis (PCA) for transcriptome profiles from the indicated mice (n = 3). f, A volcano plot showing differential expression of 2,963 YAP-upregulated genes in YAPTg Tet1−/− compared to YAPTg livers. Red dots represent remarkable (fold change ≥ 2) and significant (P < 0.00001) genes. g, i, Representative gross image and H&E staining of livers (g) and quantification of liver-to-body weight ratio (i) from CTL (n = 7), Tet1−/− (n = 9), YAPTg (n = 13) and YAPTg Tet1−/− (n = 18) mice treated with Dox starting at birth for ~2 months. h, Kaplan-Meier survival curve showing the survival of the indicated mice treated with Dox starting at birth, monitored for 120 days. j, Quantification of HCC incidence under same condition as in (g). k, l, Representative gross image and H&E staining of livers (k) and quantification of liver-to-body weight ratio (l) from CTL (n = 6), Tet1−/− (n = 6), YAPTg (n = 22) and YAPTg Tet1−/− (n = 14) mice at ~14 months of age without Dox treatment. m, Quantification of HCC incidence under same condition as in (k). Values represent mean ± s.e.m. (a, c, d, i, l). P values are calculated with unpaired two-tailed Student’s t-test (a) or one-way ANOVA with Tukey’s test (c, d, i, l).
