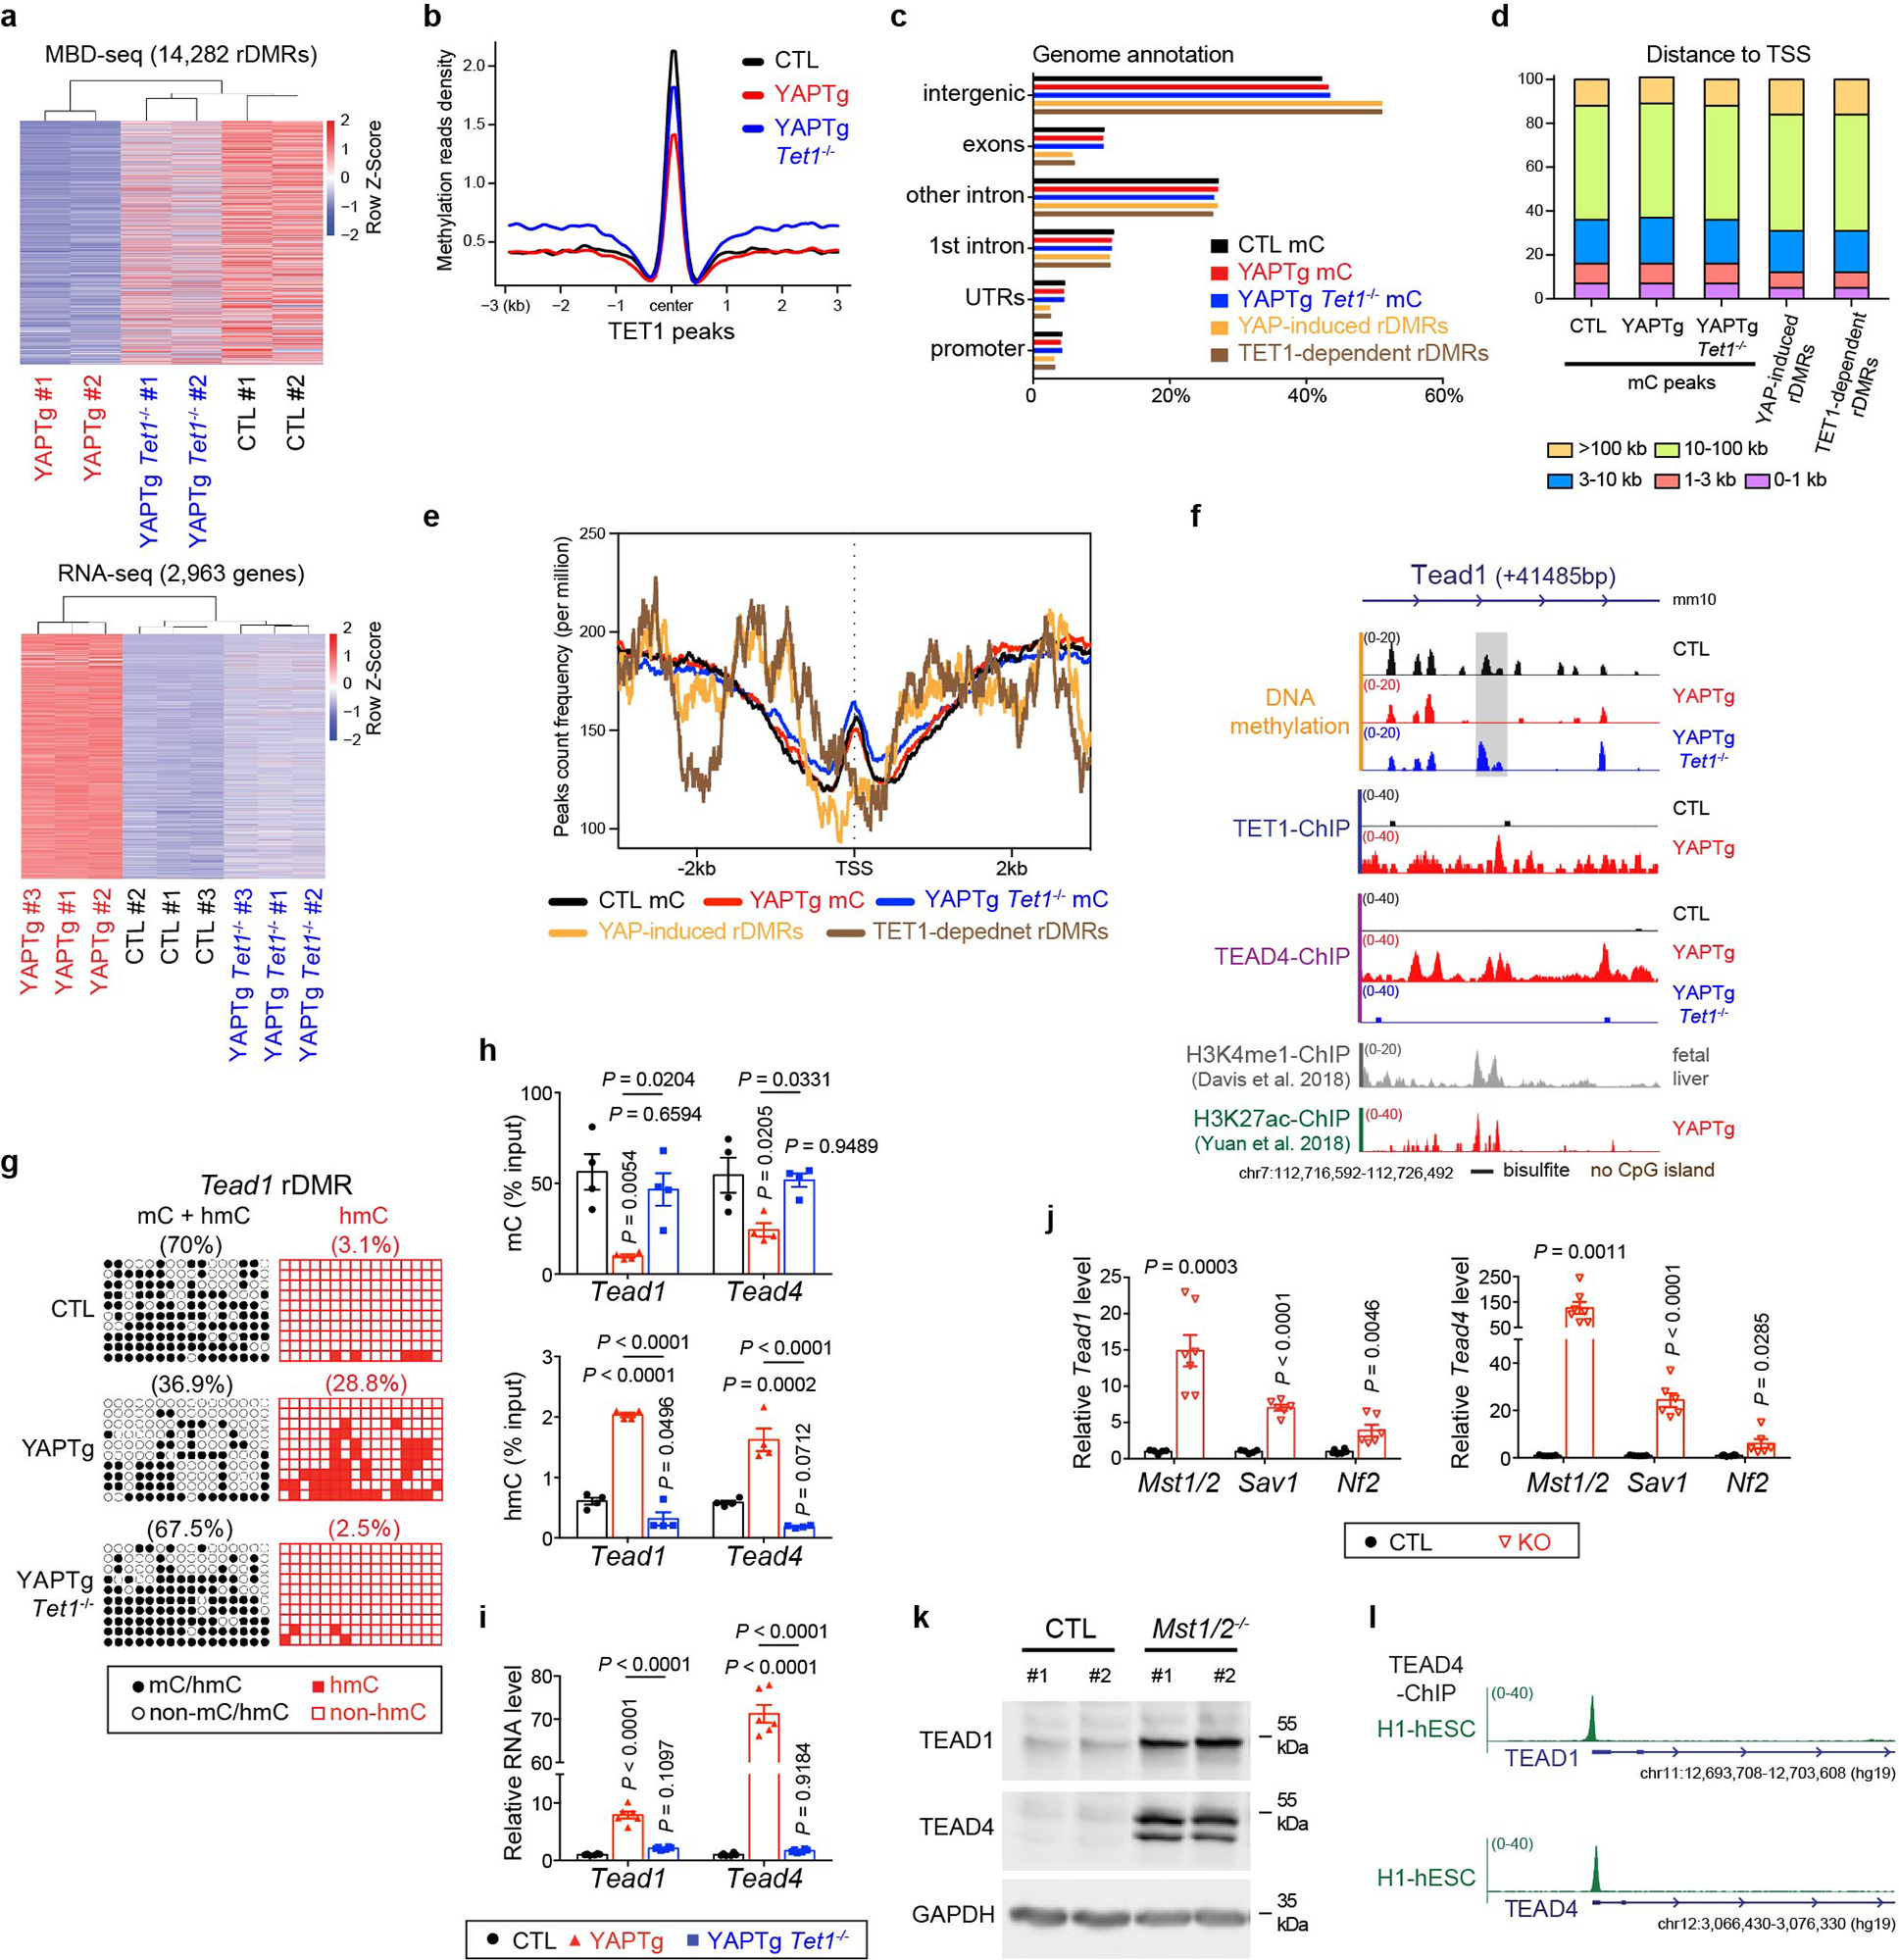
Extended Data Fig. 9. TET1-mediated DNA methylation is required for transcriptional induction of TEAD1/4.

a, Clustered heatmaps of MBD-seq data (top panel) and RNA-seq data (bottom panel) displaying sample-to-sample distance between the indicated genetic background. b, Methylation profile representing the MBD-seq signals from the indicated mutant livers centered at TET1 peaks. c, Absolute distance of methylation peaks, YAP-induced rDMRs and TET1-dependent rDMRs relative to nearest TSS. d, Genomic distribution of methylation peaks, YAP-induced rDMRs and TET1-dependent rDMRs. e, Average peak profile of methylation peaks, YAP-induced rDMRs and TET1-dependent rDMRs mapped to nearest TSS. f, Genomic tracks displaying MBD-seq, TET1 ChIP-seq, TEAD4 ChIP-seq, H3K4me1 ChIP-seq and H3K27ac ChIP-seq reads at the Tead1 rDMR locus. Grey column represents a YAP-induced rDMR region. g, Cloning-based traditional bisulfite sequencing (left panels) and TAB-seq (right panels) of 16 CpG sites at the Tead1 rDMR locus. All sequencing results include 10 independent clones. h, 5mC and 5hmC validation at the Tead1 and Tead4 rDMRs in the indicated mutant livers. Methylation (top panel) and hydroxymethylation (bottom panel) levels were determined by MBD-qPCR and hMeDIP-qPCR, respectively (n = 4). i, RT-qPCR of Tead1 and Tead4 in the indicated mutant livers. mRNA level was normalized to control livers (n = 6). j, RT-qPCR of Tead1 and Tead4 in the indicated 1-month-old mutant livers (CTL n = 5, 5, 6 and KO n = 7, 6, 6 from left to right). mRNA level was normalized to control livers. k, Western blot of TEAD1 and TEAD4 protein in Mst1/2 mutant livers. Images are representative of three independent experiments. l, Genomic tracks displaying TEAD4 ChIP-seq reads at TEAD1 and TEAD4 genes in human embryonic stem cells (H1-hESC).Values represent mean ± s.e.m. (h, i, j). P values are calculated with unpaired two-tailed Student’s t-test (j) or one-way ANOVA with Tukey’s test (h, i).
