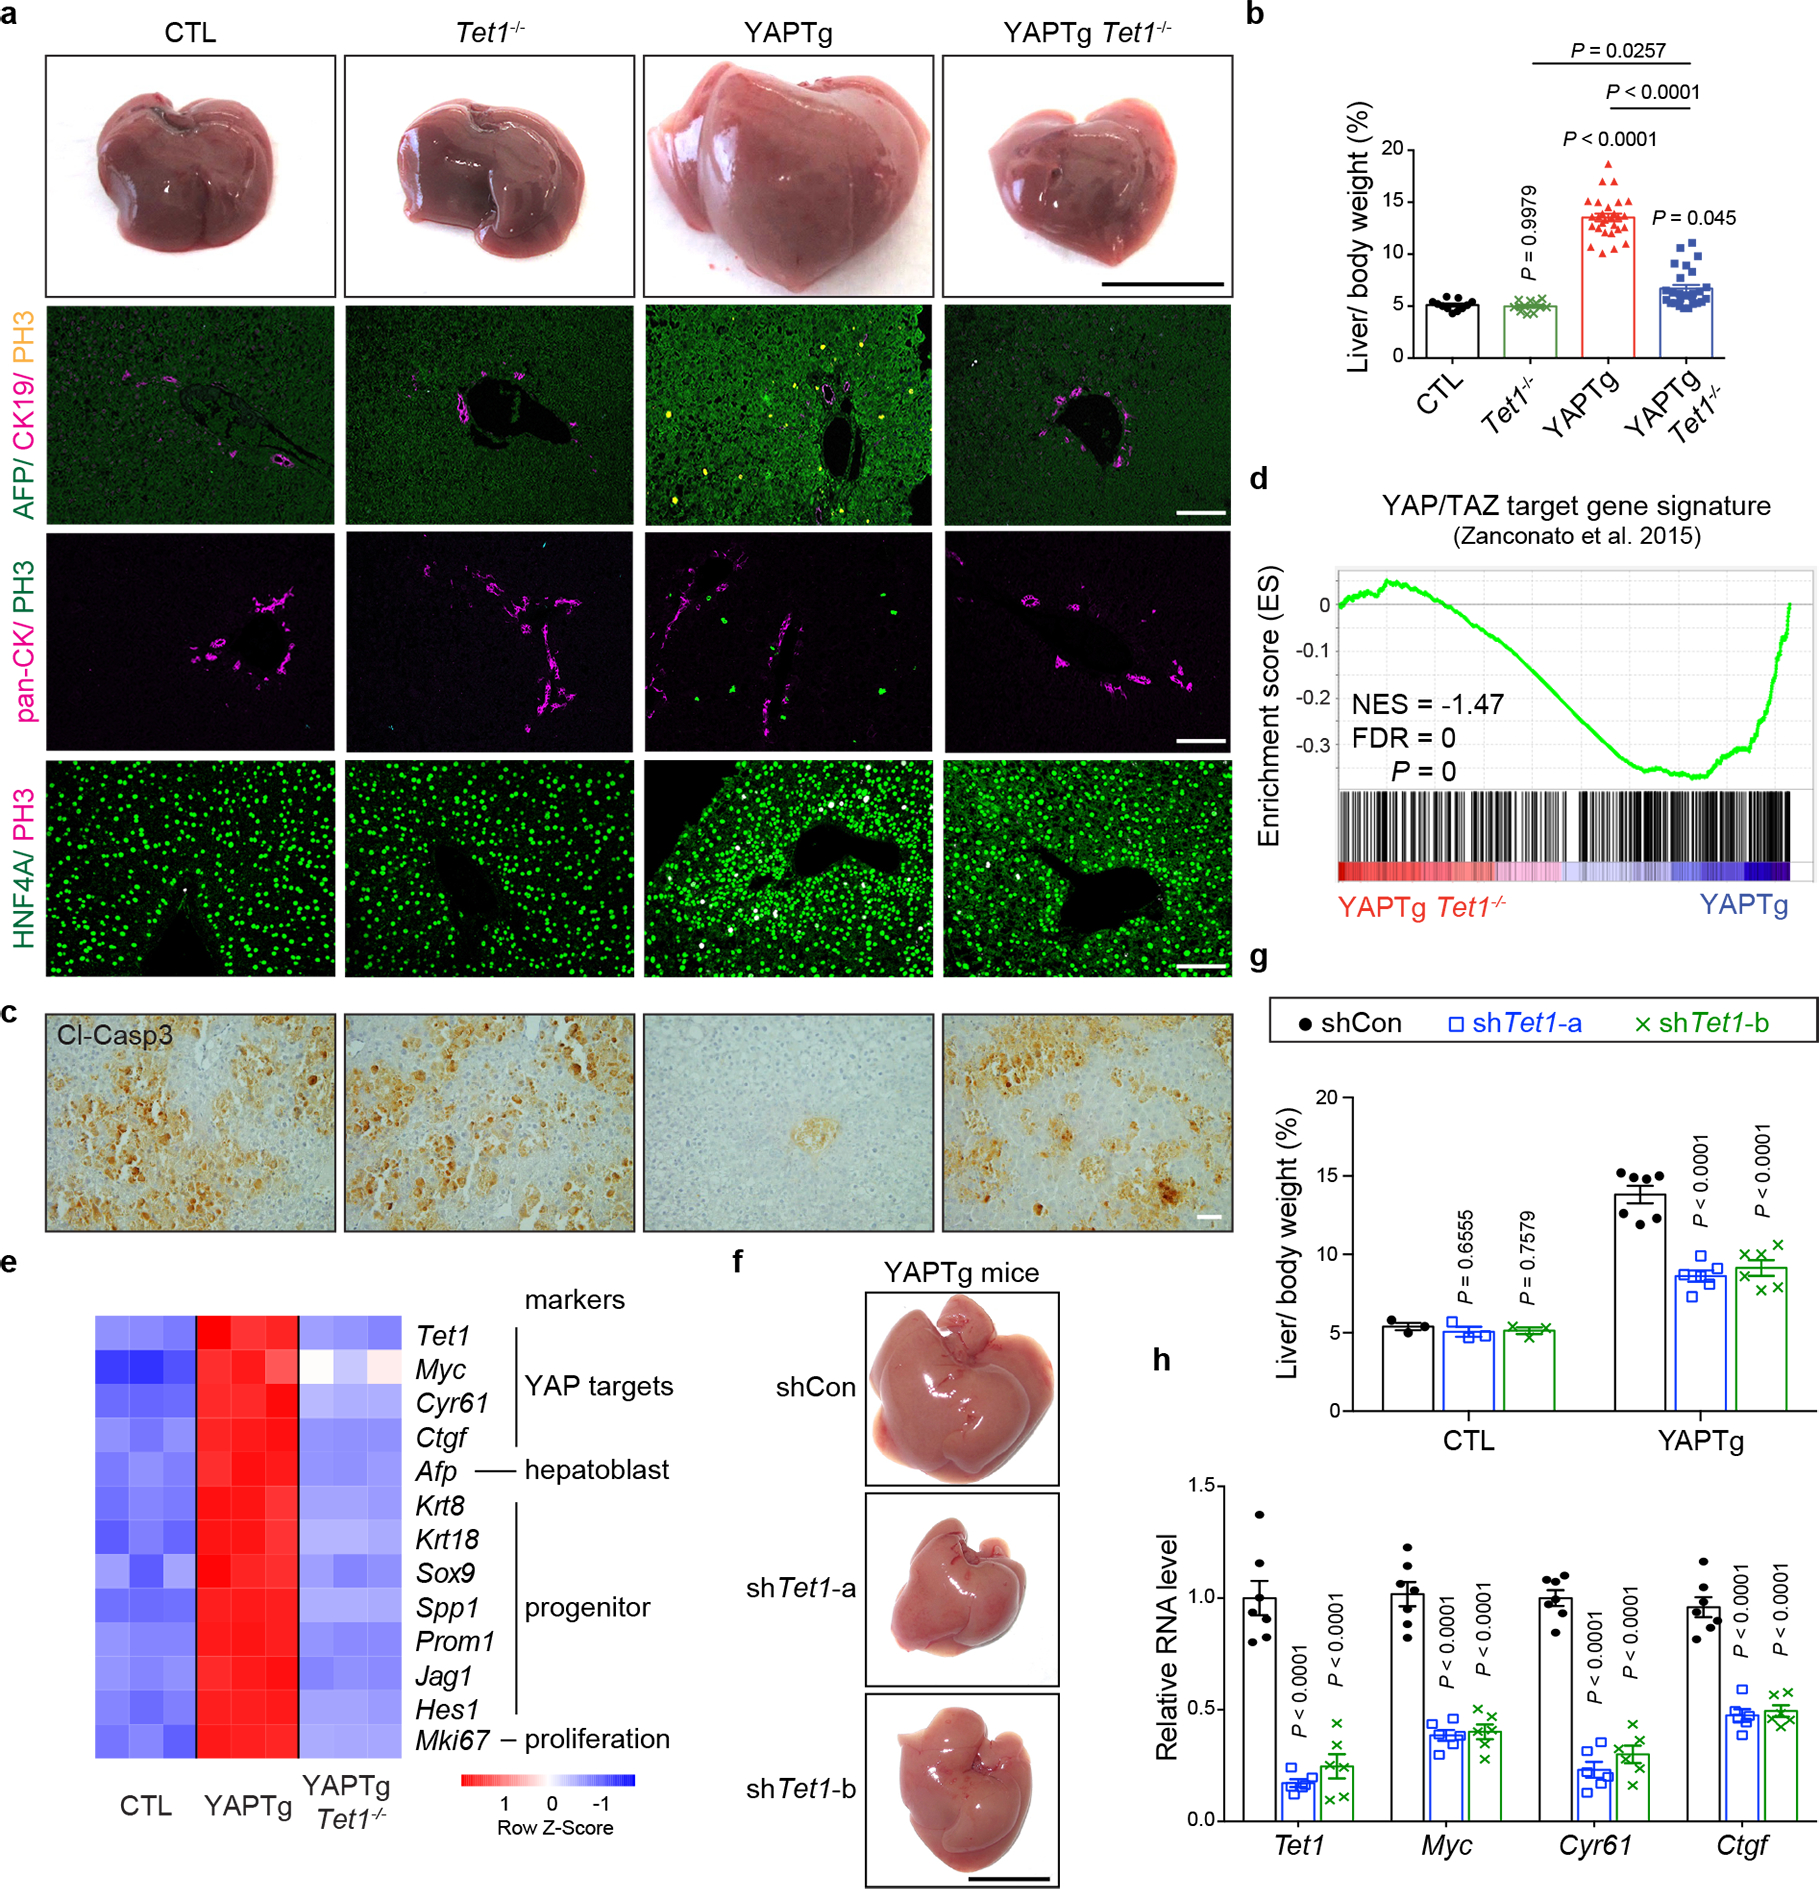
Fig. 4 |. Loss of Tet1 suppresses YAP-induced hepatomegaly and transcriptional activation.

a, b, Representative gross image and immunostaining of livers (a) and quantification of liver-to-body weight ratio (b) from CTL (n = 11), Tet1−/− (n = 11), YAPTg (n = 28) and YAPTg Tet1−/− (n = 26) mice. Black scale bar, 1 cm. White scale bar, 100 μm. c, Representative cleaved caspase-3 (Cl-casp3) staining of liver sections from CTL (n = 6), Tet1−/− (n = 3), YAPTg (n = 6) and YAPTg Tet1−/− (n = 6) mice. Mice were kept on 50 mg/l Dox for 10 days, injected with Jo-2 antibody to induce liver injury and analyzed 5 hours post injection. Scale bar, 100 μm. d, GSEA of YAPTg Tet1−/− versus YAPTg livers for the expression of previously reported direct YAP/TAZ target genes. Also indicated are normalized enrichment score (NES) and false discovery rate (FDR). e, Heatmap of RNA-seq data displaying expression of representative hepatic lineage markers between control, YAPTg and YAPTg Tet1−/− livers. f, g, Representative gross image of livers (f) and quantification of liver-to-body weight ratio (g) from shCon (n = 7), shTet1-a (n = 6) and shTet1-b (n = 6) YAPTg mice. Mice were treated with Dox and received hydrodynamic injection of non-targeting control or Tet1 shRNA lentivirus. Black scale bar, 1 cm. h, RT-qPCR of Tet1, Myc, Cyr61 and Ctgf in YAPTg livers treated with Tet1 shRNA from shCon (n = 7), shTet1-a (n = 6) and shTet1-b (n = 6) YAPTg mice. Values represent mean ± s.e.m. (b, g, h). P values are calculated with one-way ANOVA with Tukey’s test (b, g, h).
