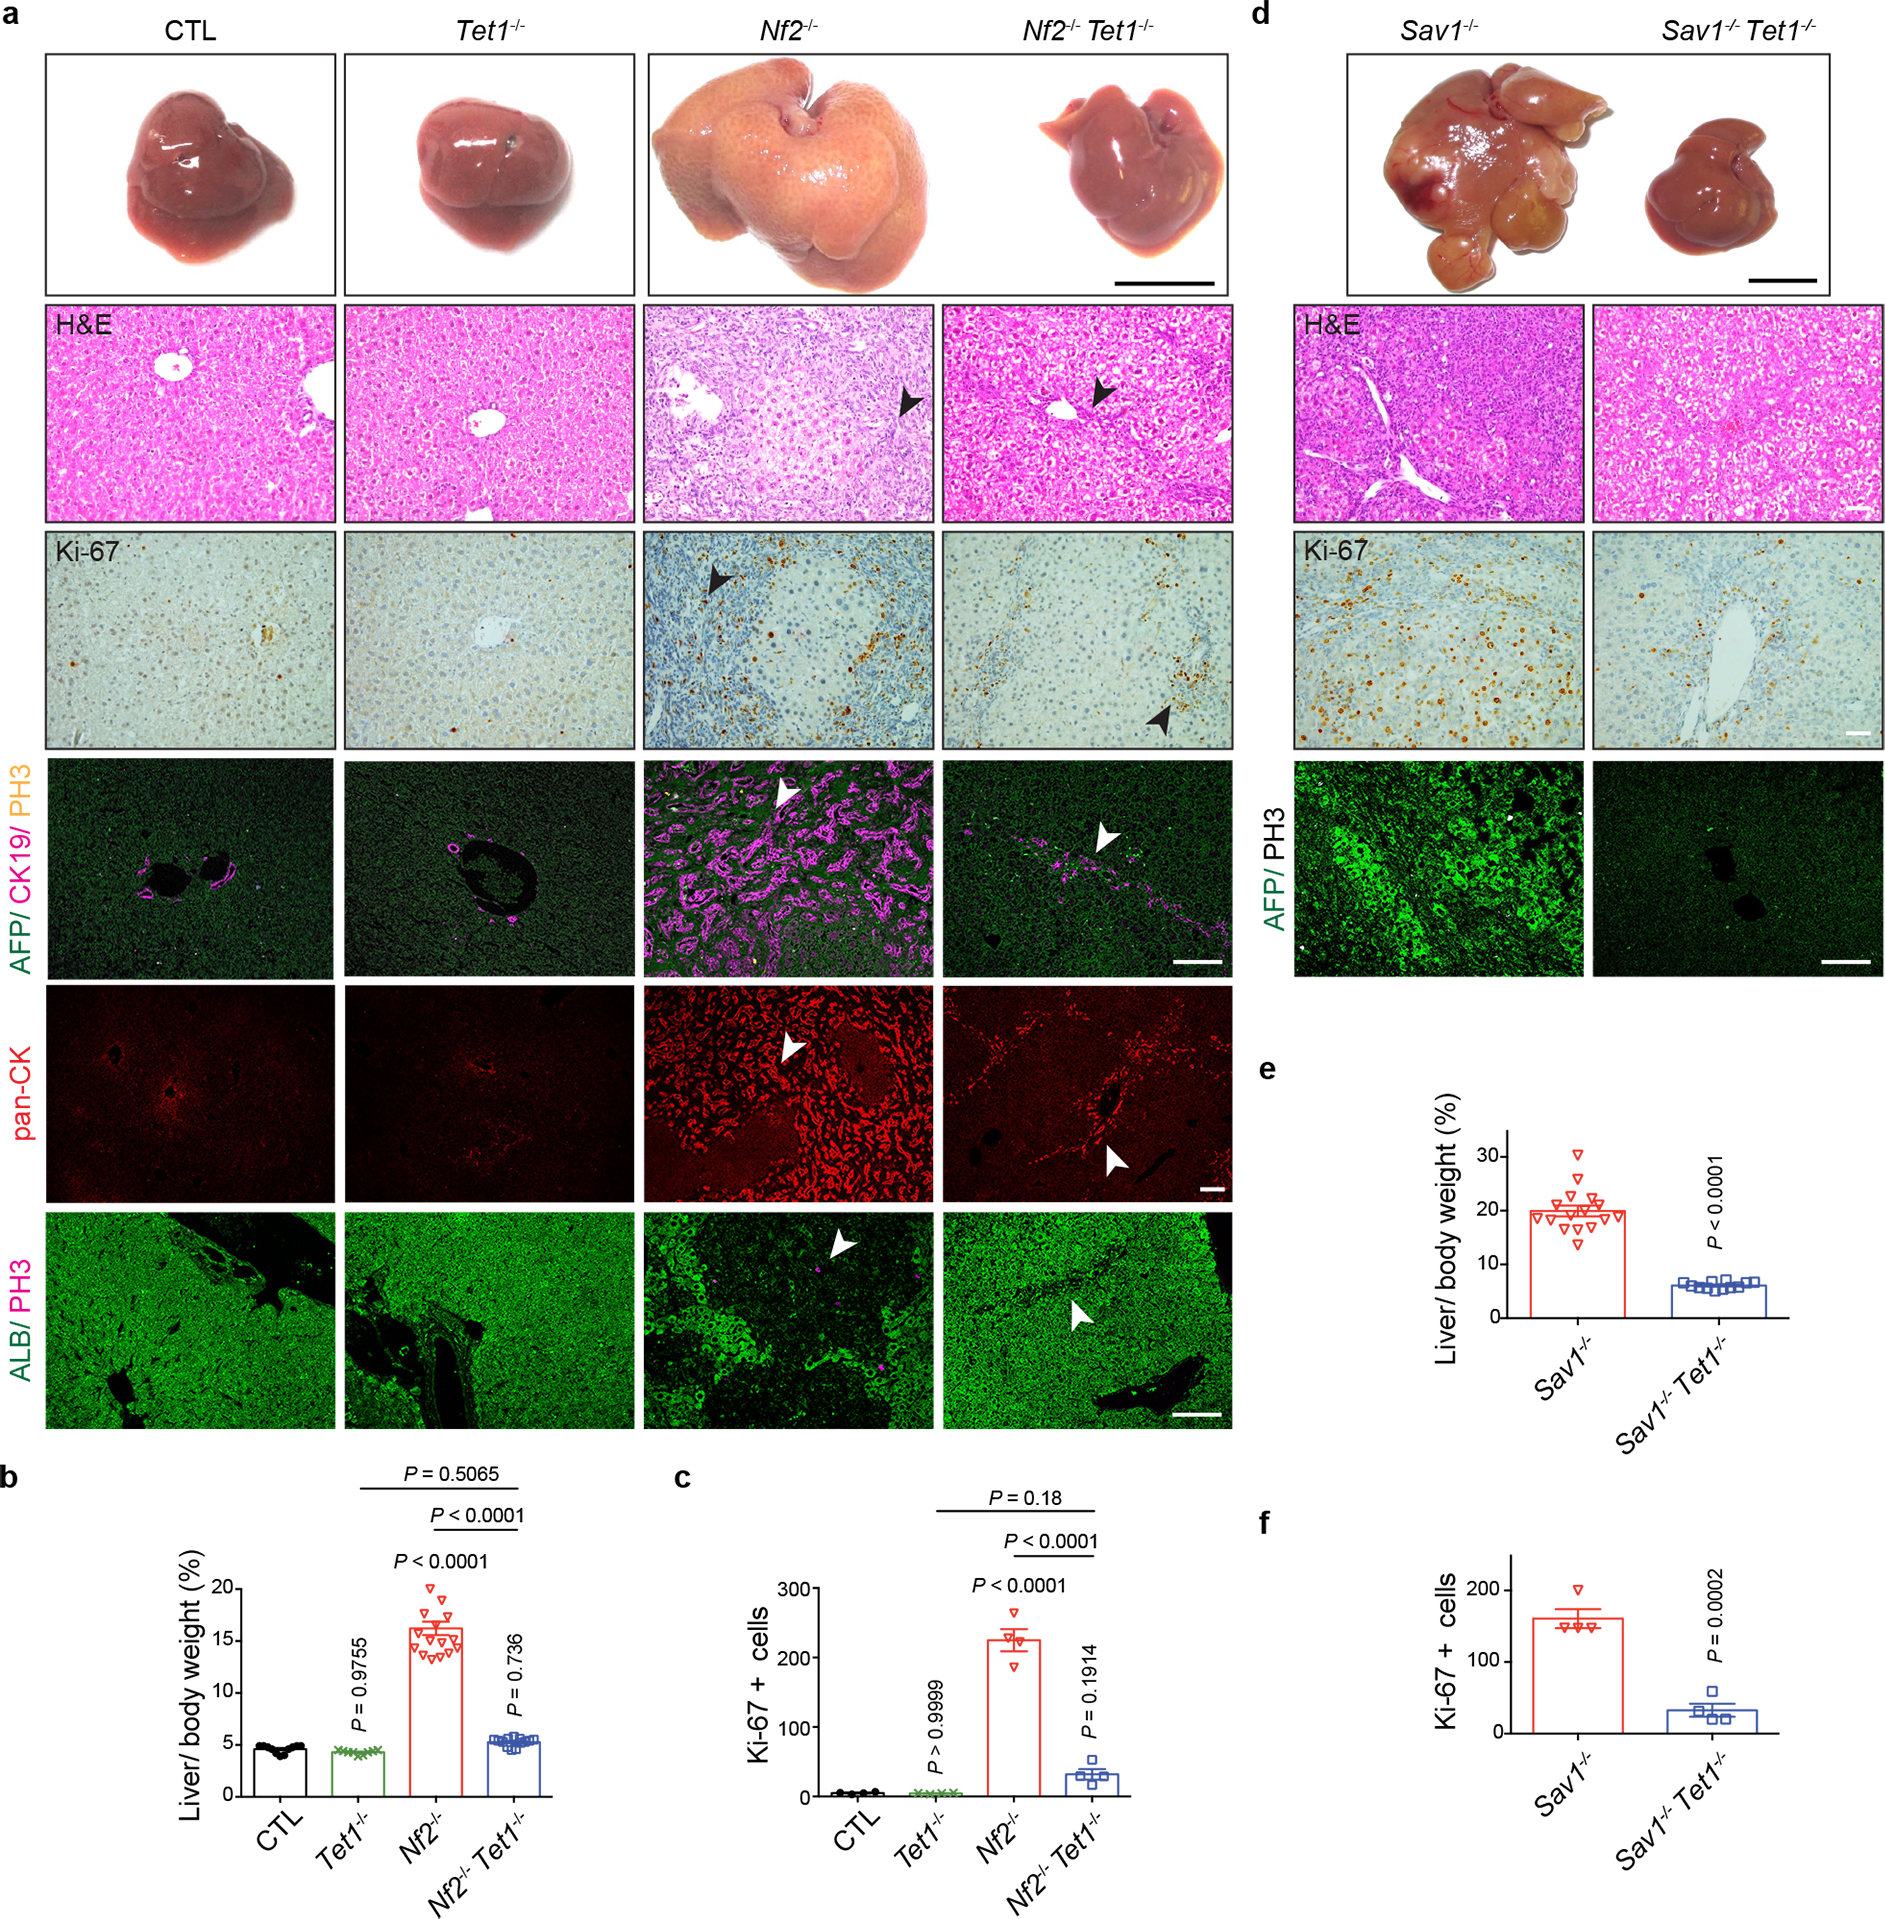
Fig. 5 |. Tet1 deletion suppresses YAP-induced hepatomegaly and tumorigenesis in diverse genetic models of YAP activation.

a, b, Representative gross image, H&E staining and immunostaining of livers (a) and quantification of liver-to-body weight ratio (b) from CTL (n = 11), Tet1−/− (n = 9), Nf2−/− (n = 17) and Nf2−/− Tet1−/− (n = 13) mice at ~6 months of age. Arrowheads mark bile duct cells expansion. Black scale bar, 1 cm. White scale bar, 100 μm. c, Quantification of Ki-67 positive cells from the indicated mice at ~6 months of age (n = 4). d, e, Representative gross image, H&E staining and immunostaining of livers (d) and quantification of liver-to-body weight ratio (e) from Sav1−/− (n = 16) and Sav1−/− Tet1−/− (n = 12) mice at ~6 months of age. Note that Tet1-deletion suppressed YAP-induced hepatomegaly and induction of the hepatoblast marker AFP. Black scale bar, 1 cm. White scale bar, 100 μm. f, Quantification of Ki-67 positive cells from the indicated mice at ~6 months of age (n = 4). Values represent mean ± s.e.m. (b, c, e, f). P values are calculated with unpaired two-tailed Student’s t-test (e, f) or one-way ANOVA with Tukey’s test (b, c).
