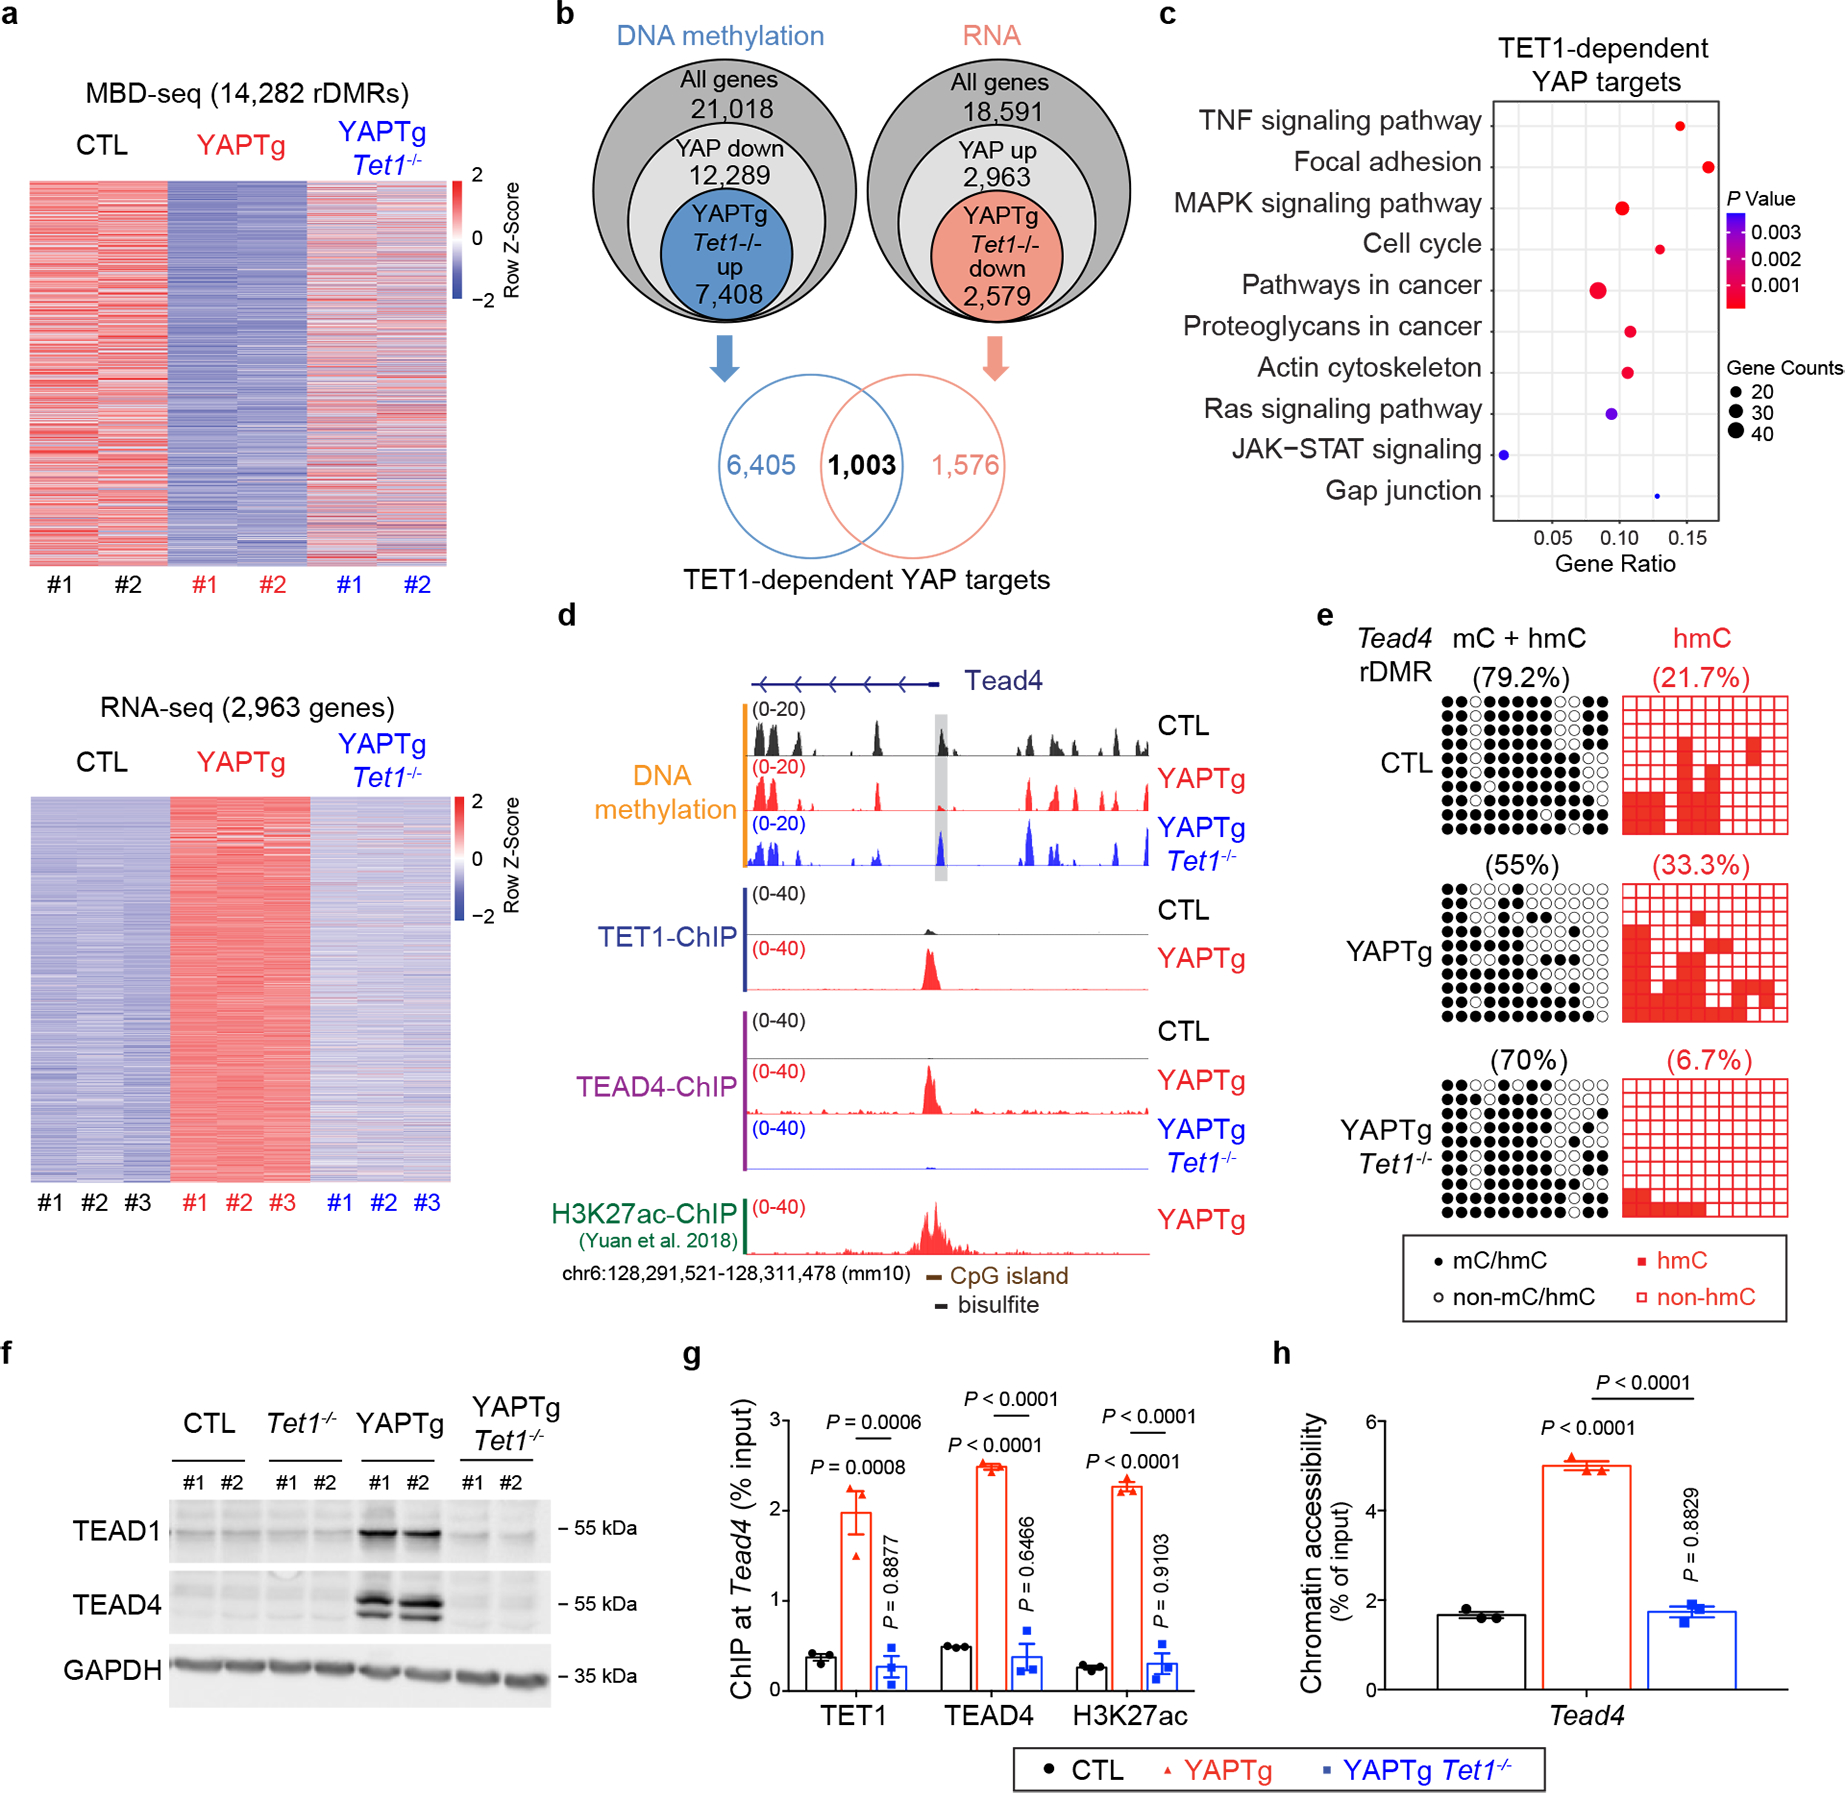
Fig. 6 |. YAP activation drives TEAD4 expression through TET1-dependent epigenetic remodeling.

a, Top panel, heatmap of MBD-seq data displaying DNA methylation changes of rDMRs in control, YAPTg and YAPTg Tet1−/− livers, ranked from highest reduction in YAPTg livers to lowest (YAP/control ≥ 3-fold decrease and P < 0.05). Bottom panel, heatmap of RNA-seq data displaying fold changes of differentially expressed genes in control, YAPTg and YAPTg Tet1−/− livers, ranked from highest induction in YAPTg livers to lowest (YAP/control ≥ 2-fold increase and P < 0.05). b, Venn diagram showing the overlap of DNA methylation (MBD-seq) and RNA expression (RNA-seq) to identify 1,003 genes regulated by TET1-dependent DNA demethylation and RNA induction (TET1-dependent YAP targets). c, Kyoto Encyclopedia of Genes and Genomes (KEGG) pathway enrichment analysis of 1,003 TET1-dependent YAP target genes. d, Genomic tracks displaying MBD-seq, TET1 ChIP-seq, TEAD4 ChIP-seq and H3K27ac ChIP-seq reads at the Tead4 rDMR locus. Grey column represents a YAP-induced rDMR region. The cloning-based locus-specific bisulfite sequencing site is also marked. e, Cloning-based traditional bisulfite sequencing (left panels) and TAB-seq (right panels) of 12 CpG sites at the Tead4 rDMR locus. All sequencing results include 10 independent clones. f, Western blot of TEAD1 and TEAD4 protein levels in the indicated livers. Images are representative of three independent experiments. g, h, ChIP-qPCR (n = 3) (g) and FAIRE-qPCR (n = 3) (h) at Tead4 rDMR in the indicated livers. Values represent mean ± s.e.m. P values are calculated with one-way ANOVA with Tukey’s test.
